Danish vs Immigrants from Grenada 7th Grade
COMPARE
Danish
Immigrants from Grenada
7th Grade
7th Grade Comparison
Danes
Immigrants from Grenada
97.4%
7TH GRADE
100.0/ 100
METRIC RATING
27th/ 347
METRIC RANK
94.8%
7TH GRADE
0.0/ 100
METRIC RATING
291st/ 347
METRIC RANK
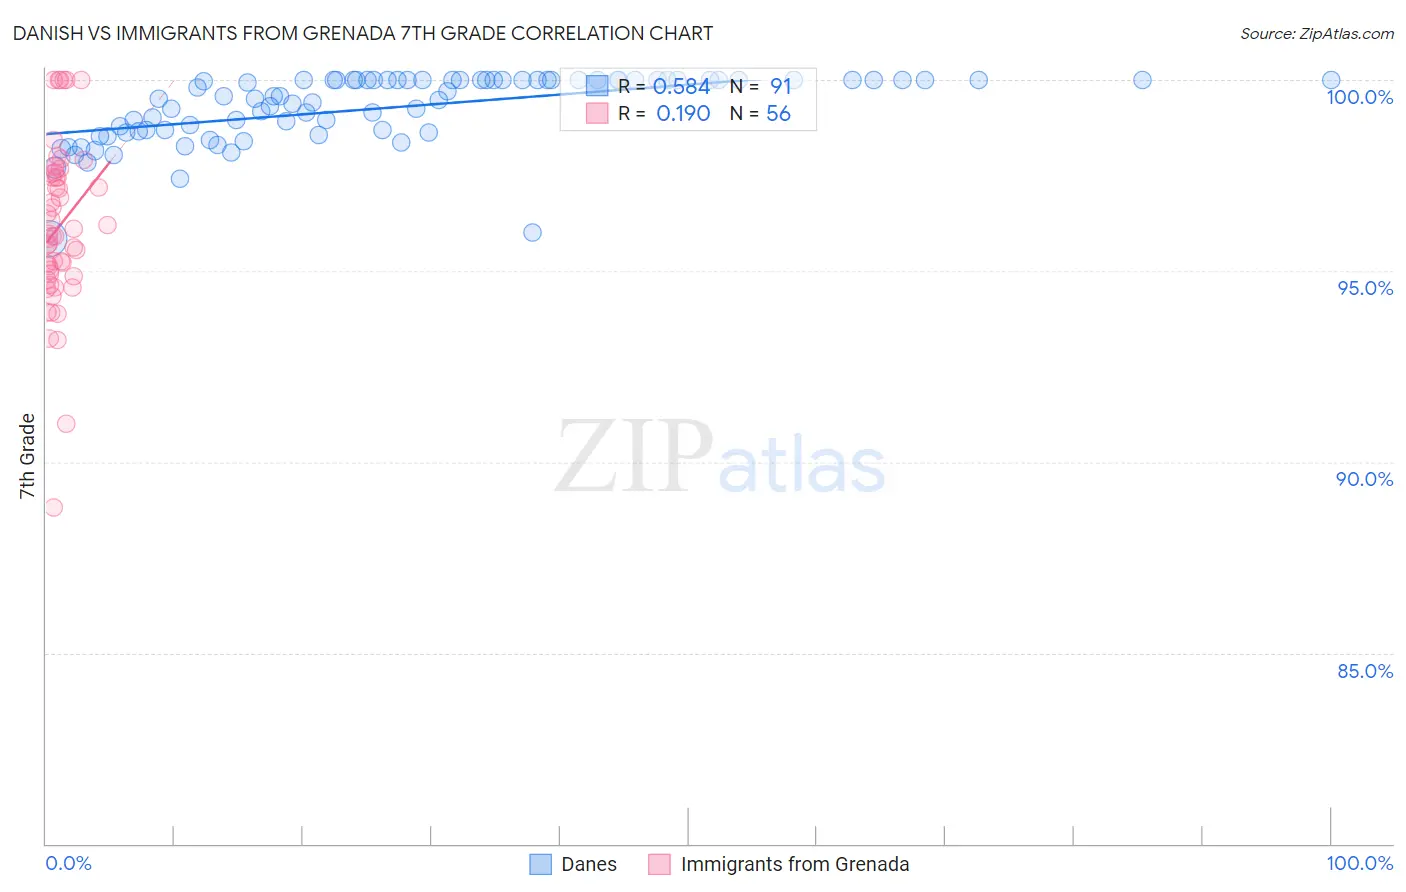
Danish vs Immigrants from Grenada 7th Grade Correlation Chart
The statistical analysis conducted on geographies consisting of 474,193,610 people shows a substantial positive correlation between the proportion of Danes and percentage of population with at least 7th grade education in the United States with a correlation coefficient (R) of 0.584 and weighted average of 97.4%. Similarly, the statistical analysis conducted on geographies consisting of 67,191,509 people shows a poor positive correlation between the proportion of Immigrants from Grenada and percentage of population with at least 7th grade education in the United States with a correlation coefficient (R) of 0.190 and weighted average of 94.8%, a difference of 2.8%.
7th Grade Correlation Summary
| Measurement | Danish | Immigrants from Grenada |
| Minimum | 95.9% | 88.8% |
| Maximum | 100.0% | 100.0% |
| Range | 4.1% | 11.2% |
| Mean | 99.3% | 96.2% |
| Median | 99.6% | 95.9% |
| Interquartile 25% (IQ1) | 98.7% | 94.9% |
| Interquartile 75% (IQ3) | 100.0% | 97.5% |
| Interquartile Range (IQR) | 1.3% | 2.6% |
| Standard Deviation (Sample) | 0.89% | 2.2% |
| Standard Deviation (Population) | 0.89% | 2.2% |
Similar Demographics by 7th Grade
Demographics Similar to Danes by 7th Grade
In terms of 7th grade, the demographic groups most similar to Danes are Scotch-Irish (97.4%, a difference of 0.0%), Welsh (97.4%, a difference of 0.010%), French (97.4%, a difference of 0.010%), Croatian (97.4%, a difference of 0.020%), and Sioux (97.4%, a difference of 0.020%).
| Demographics | Rating | Rank | 7th Grade |
| Yup'ik | 100.0 /100 | #20 | Exceptional 97.4% |
| Inupiat | 100.0 /100 | #21 | Exceptional 97.4% |
| French Canadians | 100.0 /100 | #22 | Exceptional 97.4% |
| Croatians | 100.0 /100 | #23 | Exceptional 97.4% |
| Welsh | 100.0 /100 | #24 | Exceptional 97.4% |
| French | 100.0 /100 | #25 | Exceptional 97.4% |
| Scotch-Irish | 100.0 /100 | #26 | Exceptional 97.4% |
| Danes | 100.0 /100 | #27 | Exceptional 97.4% |
| Sioux | 100.0 /100 | #28 | Exceptional 97.4% |
| Scandinavians | 100.0 /100 | #29 | Exceptional 97.4% |
| Czechs | 100.0 /100 | #30 | Exceptional 97.4% |
| Europeans | 100.0 /100 | #31 | Exceptional 97.3% |
| Italians | 100.0 /100 | #32 | Exceptional 97.3% |
| Chippewa | 100.0 /100 | #33 | Exceptional 97.3% |
| Alaska Natives | 100.0 /100 | #34 | Exceptional 97.3% |
Demographics Similar to Immigrants from Grenada by 7th Grade
In terms of 7th grade, the demographic groups most similar to Immigrants from Grenada are Immigrants from West Indies (94.8%, a difference of 0.020%), Malaysian (94.8%, a difference of 0.040%), Fijian (94.7%, a difference of 0.040%), Taiwanese (94.8%, a difference of 0.060%), and British West Indian (94.8%, a difference of 0.070%).
| Demographics | Rating | Rank | 7th Grade |
| Armenians | 0.1 /100 | #284 | Tragic 95.0% |
| Immigrants | Eritrea | 0.1 /100 | #285 | Tragic 94.9% |
| Immigrants | Philippines | 0.0 /100 | #286 | Tragic 94.9% |
| Immigrants | Peru | 0.0 /100 | #287 | Tragic 94.9% |
| British West Indians | 0.0 /100 | #288 | Tragic 94.8% |
| Taiwanese | 0.0 /100 | #289 | Tragic 94.8% |
| Malaysians | 0.0 /100 | #290 | Tragic 94.8% |
| Immigrants | Grenada | 0.0 /100 | #291 | Tragic 94.8% |
| Immigrants | West Indies | 0.0 /100 | #292 | Tragic 94.8% |
| Fijians | 0.0 /100 | #293 | Tragic 94.7% |
| Haitians | 0.0 /100 | #294 | Tragic 94.7% |
| Yaqui | 0.0 /100 | #295 | Tragic 94.6% |
| Cubans | 0.0 /100 | #296 | Tragic 94.6% |
| Immigrants | South Eastern Asia | 0.0 /100 | #297 | Tragic 94.5% |
| Indonesians | 0.0 /100 | #298 | Tragic 94.5% |