Polish vs Somali Family Households with Children
COMPARE
Polish
Somali
Family Households with Children
Family Households with Children Comparison
Poles
Somalis
26.5%
FAMILY HOUSEHOLDS WITH CHILDREN
0.2/ 100
METRIC RATING
292nd/ 347
METRIC RANK
26.7%
FAMILY HOUSEHOLDS WITH CHILDREN
0.7/ 100
METRIC RATING
272nd/ 347
METRIC RANK
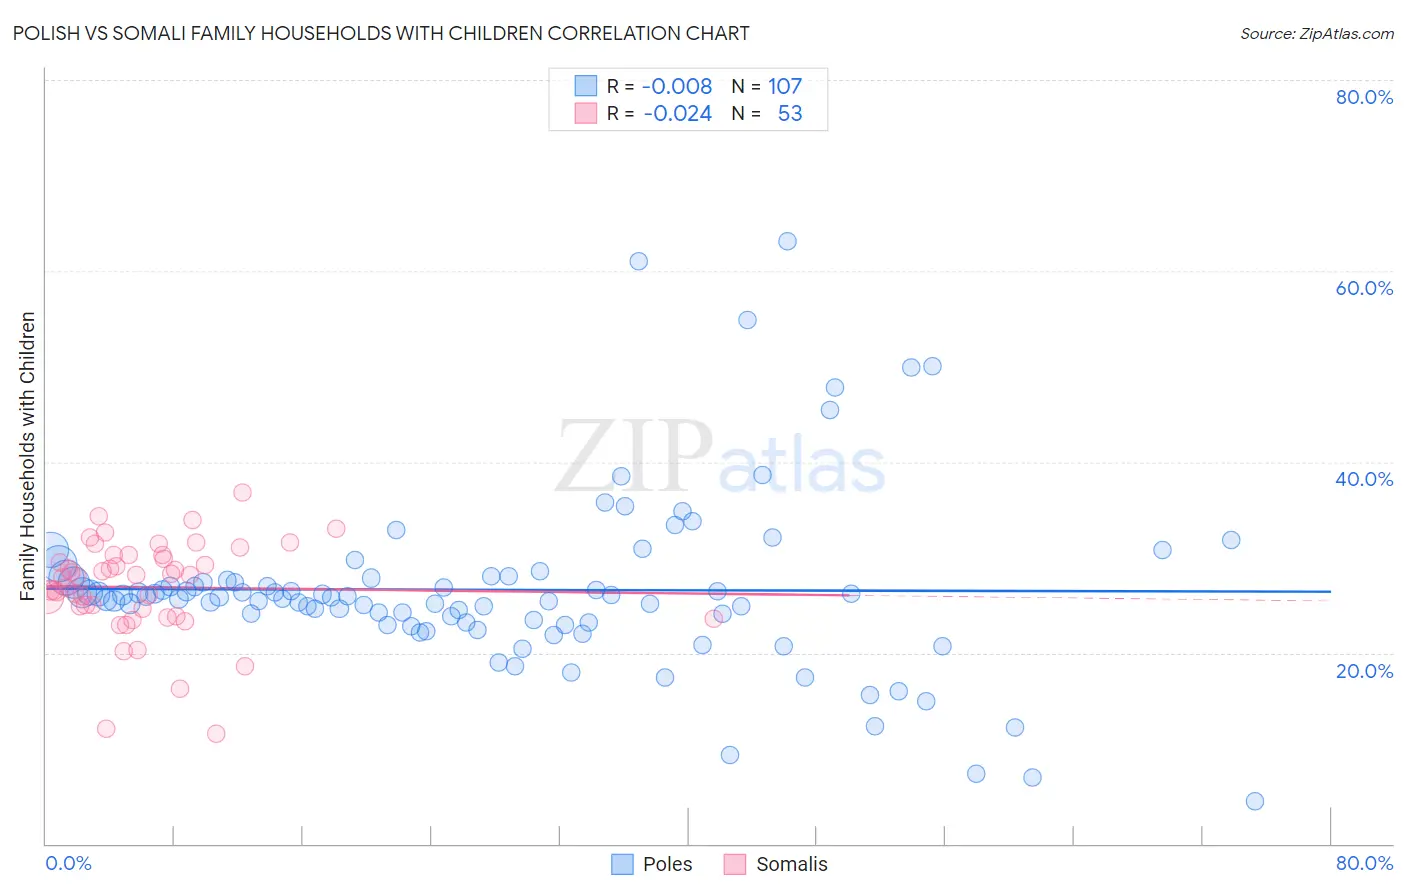
Polish vs Somali Family Households with Children Correlation Chart
The statistical analysis conducted on geographies consisting of 559,563,318 people shows no correlation between the proportion of Poles and percentage of family households with children in the United States with a correlation coefficient (R) of -0.008 and weighted average of 26.5%. Similarly, the statistical analysis conducted on geographies consisting of 99,290,252 people shows no correlation between the proportion of Somalis and percentage of family households with children in the United States with a correlation coefficient (R) of -0.024 and weighted average of 26.7%, a difference of 0.81%.
Family Households with Children Correlation Summary
| Measurement | Polish | Somali |
| Minimum | 4.5% | 11.5% |
| Maximum | 63.2% | 36.8% |
| Range | 58.7% | 25.3% |
| Mean | 26.6% | 26.9% |
| Median | 25.8% | 28.1% |
| Interquartile 25% (IQ1) | 23.1% | 24.2% |
| Interquartile 75% (IQ3) | 27.8% | 30.2% |
| Interquartile Range (IQR) | 4.7% | 6.1% |
| Standard Deviation (Sample) | 9.3% | 5.0% |
| Standard Deviation (Population) | 9.2% | 5.0% |
Demographics Similar to Poles and Somalis by Family Households with Children
In terms of family households with children, the demographic groups most similar to Poles are Albanian (26.5%, a difference of 0.010%), Bahamian (26.5%, a difference of 0.010%), Immigrants from Sweden (26.5%, a difference of 0.13%), Russian (26.5%, a difference of 0.17%), and Immigrants from Senegal (26.5%, a difference of 0.19%). Similarly, the demographic groups most similar to Somalis are Immigrants from Hungary (26.7%, a difference of 0.030%), Eastern European (26.7%, a difference of 0.040%), Immigrants from Northern Europe (26.7%, a difference of 0.12%), Immigrants from Spain (26.6%, a difference of 0.15%), and Celtic (26.6%, a difference of 0.23%).
| Demographics | Rating | Rank | Family Households with Children |
| Somalis | 0.7 /100 | #272 | Tragic 26.7% |
| Immigrants | Hungary | 0.6 /100 | #273 | Tragic 26.7% |
| Eastern Europeans | 0.6 /100 | #274 | Tragic 26.7% |
| Immigrants | Northern Europe | 0.5 /100 | #275 | Tragic 26.7% |
| Immigrants | Spain | 0.5 /100 | #276 | Tragic 26.6% |
| Celtics | 0.4 /100 | #277 | Tragic 26.6% |
| Immigrants | Europe | 0.4 /100 | #278 | Tragic 26.6% |
| Finns | 0.4 /100 | #279 | Tragic 26.6% |
| Senegalese | 0.4 /100 | #280 | Tragic 26.6% |
| Lithuanians | 0.3 /100 | #281 | Tragic 26.6% |
| French American Indians | 0.3 /100 | #282 | Tragic 26.6% |
| Immigrants | North America | 0.3 /100 | #283 | Tragic 26.6% |
| Immigrants | Canada | 0.3 /100 | #284 | Tragic 26.5% |
| Cambodians | 0.2 /100 | #285 | Tragic 26.5% |
| Immigrants | Senegal | 0.2 /100 | #286 | Tragic 26.5% |
| Shoshone | 0.2 /100 | #287 | Tragic 26.5% |
| Russians | 0.2 /100 | #288 | Tragic 26.5% |
| Immigrants | Sweden | 0.2 /100 | #289 | Tragic 26.5% |
| Albanians | 0.2 /100 | #290 | Tragic 26.5% |
| Bahamians | 0.2 /100 | #291 | Tragic 26.5% |
| Poles | 0.2 /100 | #292 | Tragic 26.5% |