Polish vs Immigrants from Uganda Nursery School
COMPARE
Polish
Immigrants from Uganda
Nursery School
Nursery School Comparison
Poles
Immigrants from Uganda
98.6%
NURSERY SCHOOL
100.0/ 100
METRIC RATING
23rd/ 347
METRIC RANK
97.9%
NURSERY SCHOOL
18.0/ 100
METRIC RATING
203rd/ 347
METRIC RANK
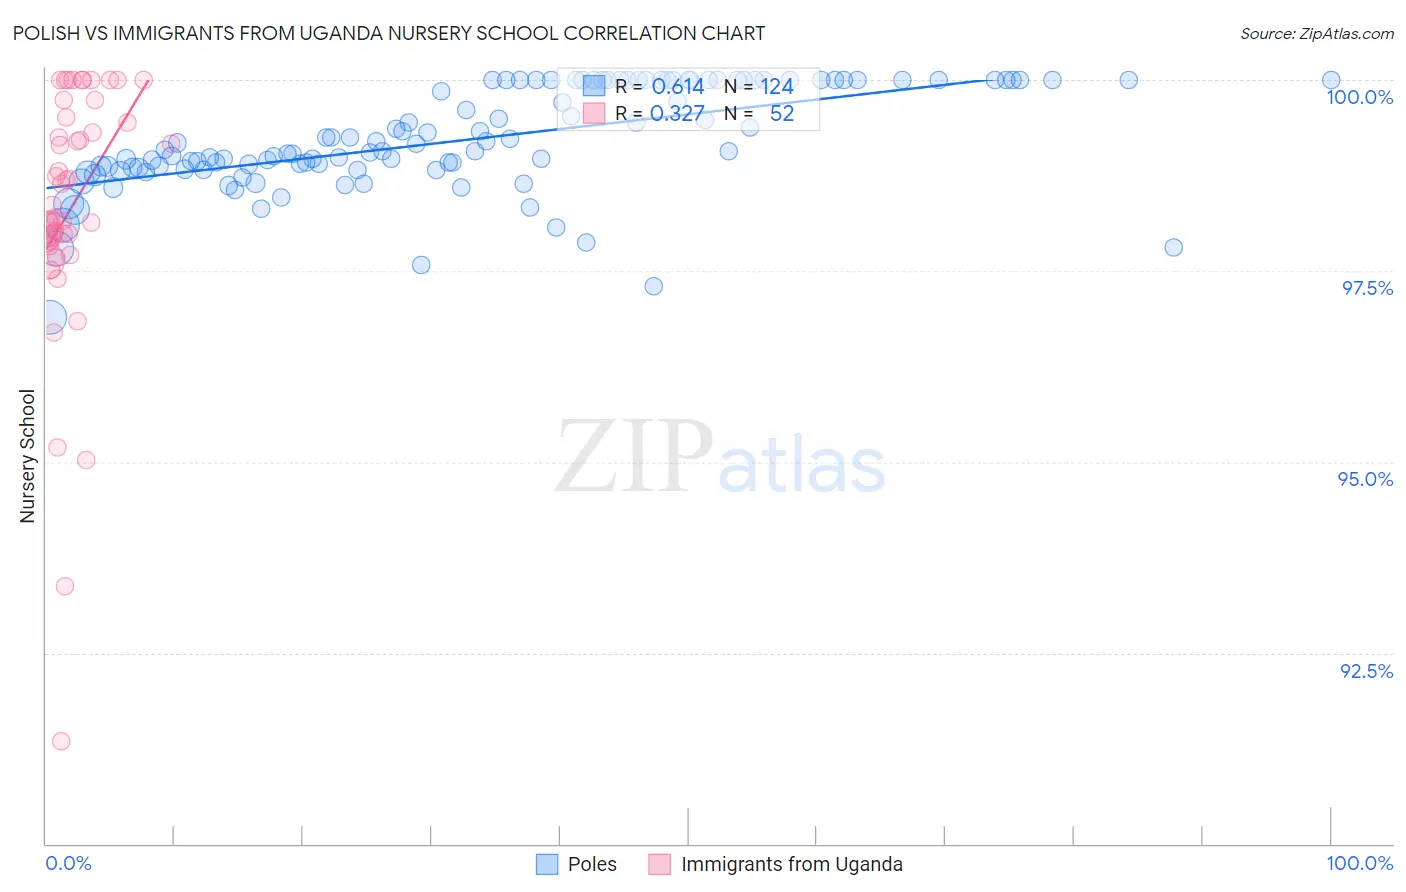
Polish vs Immigrants from Uganda Nursery School Correlation Chart
The statistical analysis conducted on geographies consisting of 560,594,514 people shows a significant positive correlation between the proportion of Poles and percentage of population with at least nursery school education in the United States with a correlation coefficient (R) of 0.614 and weighted average of 98.6%. Similarly, the statistical analysis conducted on geographies consisting of 125,941,298 people shows a mild positive correlation between the proportion of Immigrants from Uganda and percentage of population with at least nursery school education in the United States with a correlation coefficient (R) of 0.327 and weighted average of 97.9%, a difference of 0.77%.
Nursery School Correlation Summary
| Measurement | Polish | Immigrants from Uganda |
| Minimum | 96.9% | 91.3% |
| Maximum | 100.0% | 100.0% |
| Range | 3.1% | 8.7% |
| Mean | 99.2% | 98.3% |
| Median | 99.1% | 98.3% |
| Interquartile 25% (IQ1) | 98.8% | 97.9% |
| Interquartile 75% (IQ3) | 100.0% | 99.5% |
| Interquartile Range (IQR) | 1.2% | 1.6% |
| Standard Deviation (Sample) | 0.68% | 1.7% |
| Standard Deviation (Population) | 0.67% | 1.7% |
Similar Demographics by Nursery School
Demographics Similar to Poles by Nursery School
In terms of nursery school, the demographic groups most similar to Poles are Pennsylvania German (98.6%, a difference of 0.0%), Finnish (98.6%, a difference of 0.0%), Lithuanian (98.6%, a difference of 0.0%), Danish (98.6%, a difference of 0.0%), and Scotch-Irish (98.6%, a difference of 0.0%).
| Demographics | Rating | Rank | Nursery School |
| Scottish | 100.0 /100 | #16 | Exceptional 98.7% |
| Aleuts | 100.0 /100 | #17 | Exceptional 98.7% |
| Dutch | 100.0 /100 | #18 | Exceptional 98.7% |
| Irish | 100.0 /100 | #19 | Exceptional 98.6% |
| Pennsylvania Germans | 100.0 /100 | #20 | Exceptional 98.6% |
| Finns | 100.0 /100 | #21 | Exceptional 98.6% |
| Lithuanians | 100.0 /100 | #22 | Exceptional 98.6% |
| Poles | 100.0 /100 | #23 | Exceptional 98.6% |
| Danes | 100.0 /100 | #24 | Exceptional 98.6% |
| Scotch-Irish | 100.0 /100 | #25 | Exceptional 98.6% |
| Sioux | 100.0 /100 | #26 | Exceptional 98.6% |
| Arapaho | 100.0 /100 | #27 | Exceptional 98.6% |
| Croatians | 100.0 /100 | #28 | Exceptional 98.6% |
| French | 100.0 /100 | #29 | Exceptional 98.6% |
| Europeans | 100.0 /100 | #30 | Exceptional 98.6% |
Demographics Similar to Immigrants from Uganda by Nursery School
In terms of nursery school, the demographic groups most similar to Immigrants from Uganda are Immigrants from Southern Europe (97.9%, a difference of 0.0%), Immigrants from Chile (97.9%, a difference of 0.0%), Immigrants from Ukraine (97.9%, a difference of 0.010%), Immigrants from Albania (97.9%, a difference of 0.010%), and African (97.9%, a difference of 0.010%).
| Demographics | Rating | Rank | Nursery School |
| Guamanians/Chamorros | 25.7 /100 | #196 | Fair 97.9% |
| Yuman | 25.7 /100 | #197 | Fair 97.9% |
| Immigrants | Kenya | 24.1 /100 | #198 | Fair 97.9% |
| Immigrants | Egypt | 22.5 /100 | #199 | Fair 97.9% |
| Tohono O'odham | 22.2 /100 | #200 | Fair 97.9% |
| Immigrants | Lebanon | 21.2 /100 | #201 | Fair 97.9% |
| Immigrants | Ukraine | 19.9 /100 | #202 | Poor 97.9% |
| Immigrants | Uganda | 18.0 /100 | #203 | Poor 97.9% |
| Immigrants | Southern Europe | 17.4 /100 | #204 | Poor 97.9% |
| Immigrants | Chile | 17.3 /100 | #205 | Poor 97.9% |
| Immigrants | Albania | 16.4 /100 | #206 | Poor 97.9% |
| Africans | 15.4 /100 | #207 | Poor 97.9% |
| Immigrants | Northern Africa | 11.7 /100 | #208 | Poor 97.8% |
| Costa Ricans | 11.3 /100 | #209 | Poor 97.8% |
| Immigrants | Oceania | 10.2 /100 | #210 | Poor 97.8% |