Pima vs Bahamian 11th Grade
COMPARE
Pima
Bahamian
11th Grade
11th Grade Comparison
Pima
Bahamians
88.3%
11TH GRADE
0.0/ 100
METRIC RATING
323rd/ 347
METRIC RANK
91.6%
11TH GRADE
1.8/ 100
METRIC RATING
241st/ 347
METRIC RANK
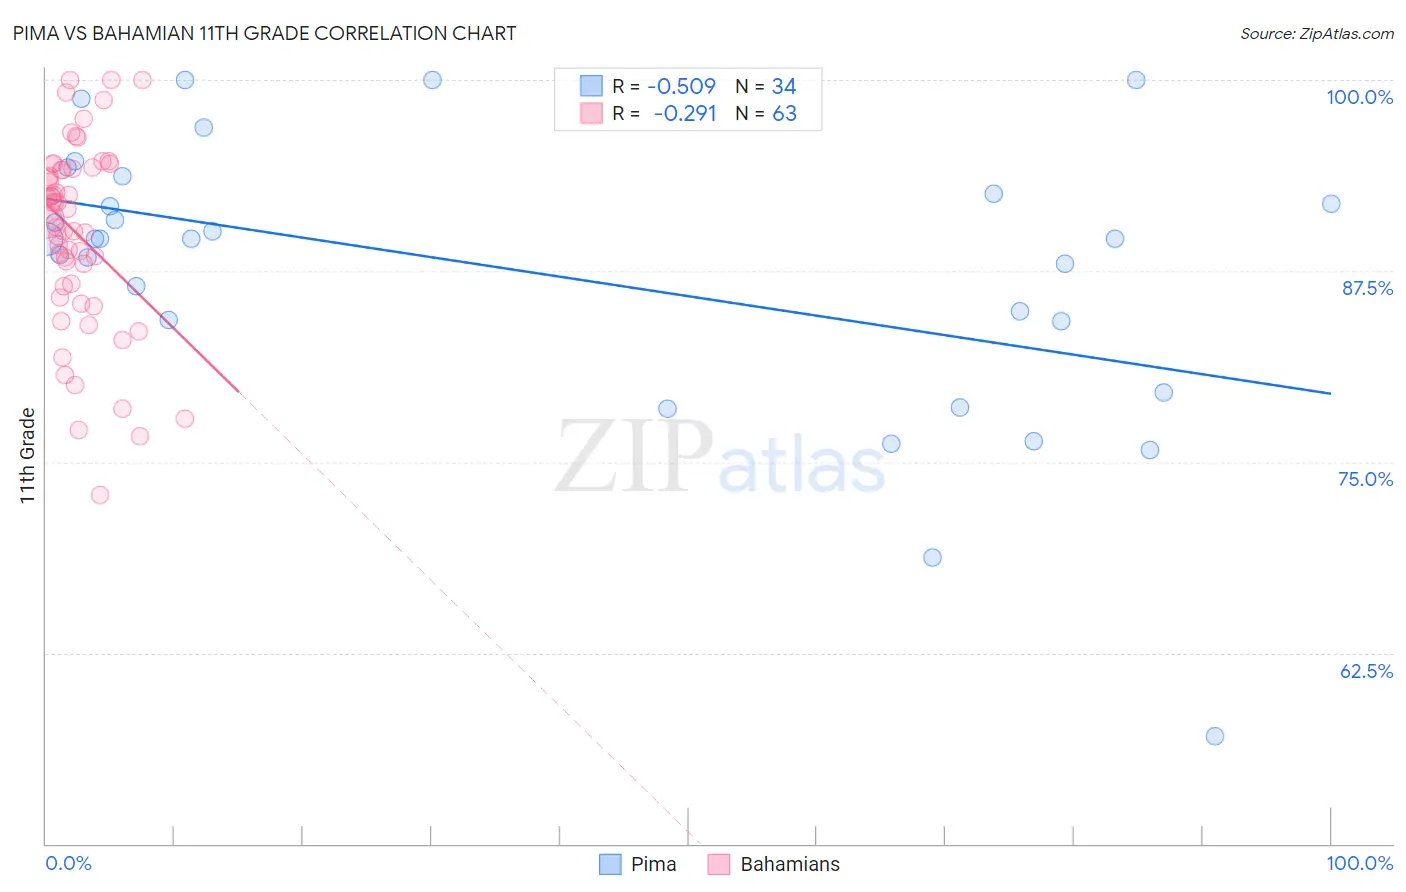
Pima vs Bahamian 11th Grade Correlation Chart
The statistical analysis conducted on geographies consisting of 61,552,942 people shows a substantial negative correlation between the proportion of Pima and percentage of population with at least 11th grade education in the United States with a correlation coefficient (R) of -0.509 and weighted average of 88.3%. Similarly, the statistical analysis conducted on geographies consisting of 112,698,819 people shows a weak negative correlation between the proportion of Bahamians and percentage of population with at least 11th grade education in the United States with a correlation coefficient (R) of -0.291 and weighted average of 91.6%, a difference of 3.8%.
11th Grade Correlation Summary
| Measurement | Pima | Bahamian |
| Minimum | 57.0% | 72.8% |
| Maximum | 100.0% | 100.0% |
| Range | 43.0% | 27.2% |
| Mean | 87.3% | 90.0% |
| Median | 89.6% | 91.2% |
| Interquartile 25% (IQ1) | 84.2% | 86.5% |
| Interquartile 75% (IQ3) | 92.6% | 94.2% |
| Interquartile Range (IQR) | 8.4% | 7.7% |
| Standard Deviation (Sample) | 9.3% | 6.1% |
| Standard Deviation (Population) | 9.2% | 6.1% |
Similar Demographics by 11th Grade
Demographics Similar to Pima by 11th Grade
In terms of 11th grade, the demographic groups most similar to Pima are Central American Indian (88.2%, a difference of 0.040%), Puerto Rican (88.4%, a difference of 0.080%), Immigrants from Nicaragua (88.1%, a difference of 0.17%), Immigrants from Belize (88.7%, a difference of 0.47%), and Immigrants from Armenia (88.8%, a difference of 0.55%).
| Demographics | Rating | Rank | 11th Grade |
| Immigrants | Cuba | 0.0 /100 | #316 | Tragic 88.9% |
| Lumbee | 0.0 /100 | #317 | Tragic 88.9% |
| Nicaraguans | 0.0 /100 | #318 | Tragic 88.9% |
| Belizeans | 0.0 /100 | #319 | Tragic 88.8% |
| Immigrants | Armenia | 0.0 /100 | #320 | Tragic 88.8% |
| Immigrants | Belize | 0.0 /100 | #321 | Tragic 88.7% |
| Puerto Ricans | 0.0 /100 | #322 | Tragic 88.4% |
| Pima | 0.0 /100 | #323 | Tragic 88.3% |
| Central American Indians | 0.0 /100 | #324 | Tragic 88.2% |
| Immigrants | Nicaragua | 0.0 /100 | #325 | Tragic 88.1% |
| Dominicans | 0.0 /100 | #326 | Tragic 87.7% |
| Immigrants | Cabo Verde | 0.0 /100 | #327 | Tragic 87.6% |
| Tohono O'odham | 0.0 /100 | #328 | Tragic 87.6% |
| Mexican American Indians | 0.0 /100 | #329 | Tragic 87.5% |
| Hondurans | 0.0 /100 | #330 | Tragic 87.4% |
Demographics Similar to Bahamians by 11th Grade
In terms of 11th grade, the demographic groups most similar to Bahamians are South American (91.6%, a difference of 0.020%), Immigrants from Middle Africa (91.6%, a difference of 0.030%), Immigrants from Thailand (91.6%, a difference of 0.060%), Senegalese (91.6%, a difference of 0.070%), and Hopi (91.7%, a difference of 0.080%).
| Demographics | Rating | Rank | 11th Grade |
| Armenians | 2.9 /100 | #234 | Tragic 91.7% |
| Sub-Saharan Africans | 2.9 /100 | #235 | Tragic 91.7% |
| Colombians | 2.8 /100 | #236 | Tragic 91.7% |
| Immigrants | Bolivia | 2.8 /100 | #237 | Tragic 91.7% |
| Comanche | 2.6 /100 | #238 | Tragic 91.7% |
| Hopi | 2.5 /100 | #239 | Tragic 91.7% |
| South Americans | 2.0 /100 | #240 | Tragic 91.6% |
| Bahamians | 1.8 /100 | #241 | Tragic 91.6% |
| Immigrants | Middle Africa | 1.6 /100 | #242 | Tragic 91.6% |
| Immigrants | Thailand | 1.4 /100 | #243 | Tragic 91.6% |
| Senegalese | 1.4 /100 | #244 | Tragic 91.6% |
| Africans | 1.3 /100 | #245 | Tragic 91.5% |
| Seminole | 1.2 /100 | #246 | Tragic 91.5% |
| Immigrants | Philippines | 1.0 /100 | #247 | Tragic 91.5% |
| Immigrants | Uzbekistan | 1.0 /100 | #248 | Tragic 91.5% |