Immigrants from Scotland vs Immigrants from Belize High School Diploma
COMPARE
Immigrants from Scotland
Immigrants from Belize
High School Diploma
High School Diploma Comparison
Immigrants from Scotland
Immigrants from Belize
91.3%
HIGH SCHOOL DIPLOMA
99.8/ 100
METRIC RATING
38th/ 347
METRIC RANK
84.2%
HIGH SCHOOL DIPLOMA
0.0/ 100
METRIC RATING
318th/ 347
METRIC RANK
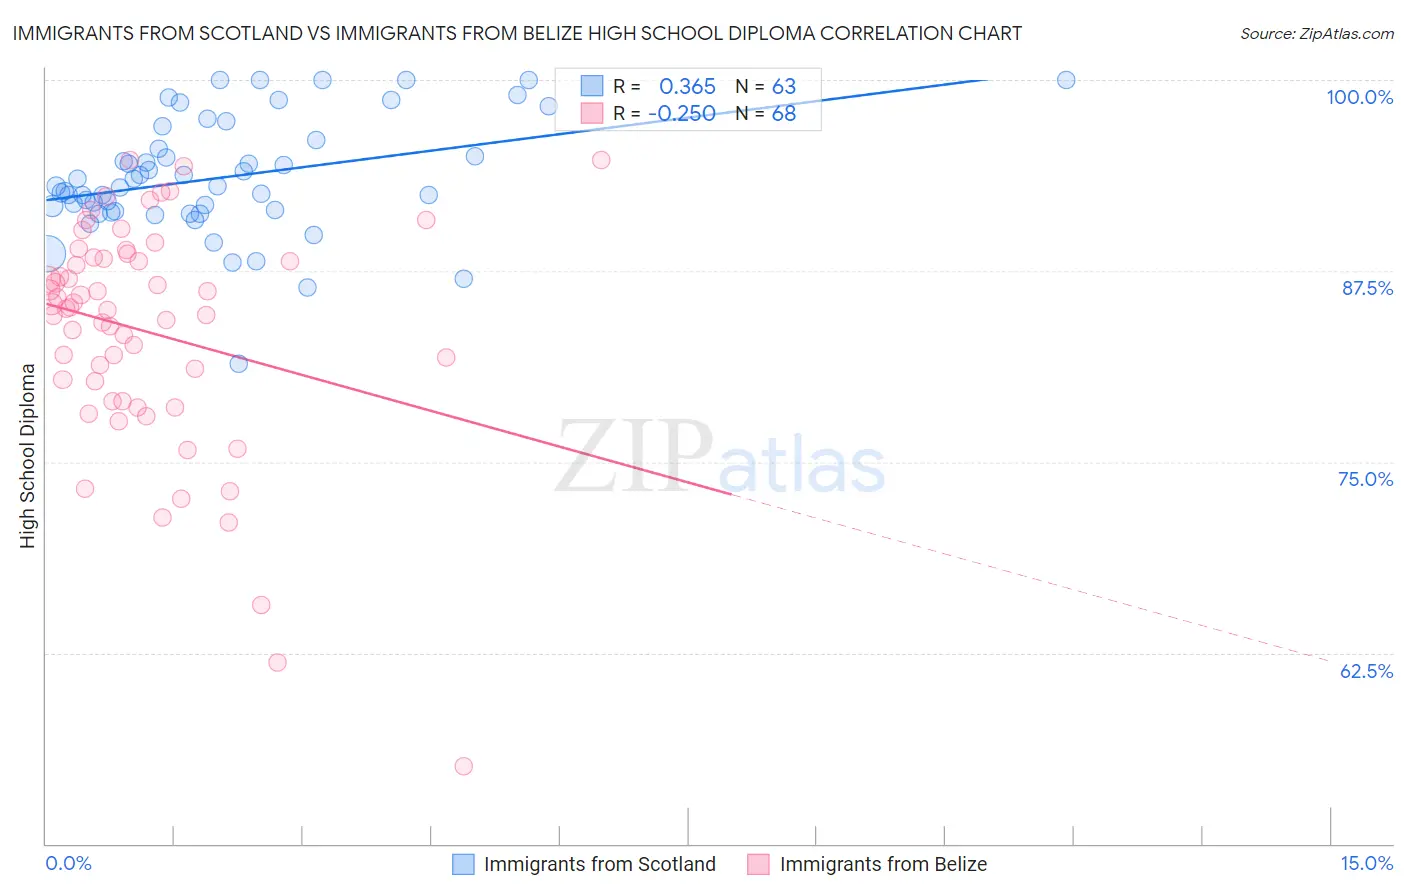
Immigrants from Scotland vs Immigrants from Belize High School Diploma Correlation Chart
The statistical analysis conducted on geographies consisting of 196,397,786 people shows a mild positive correlation between the proportion of Immigrants from Scotland and percentage of population with at least high school diploma education in the United States with a correlation coefficient (R) of 0.365 and weighted average of 91.3%. Similarly, the statistical analysis conducted on geographies consisting of 130,181,087 people shows a weak negative correlation between the proportion of Immigrants from Belize and percentage of population with at least high school diploma education in the United States with a correlation coefficient (R) of -0.250 and weighted average of 84.2%, a difference of 8.4%.
High School Diploma Correlation Summary
| Measurement | Immigrants from Scotland | Immigrants from Belize |
| Minimum | 81.4% | 55.0% |
| Maximum | 100.0% | 94.8% |
| Range | 18.6% | 39.7% |
| Mean | 93.6% | 83.5% |
| Median | 93.0% | 85.1% |
| Interquartile 25% (IQ1) | 91.4% | 79.6% |
| Interquartile 75% (IQ3) | 96.1% | 88.3% |
| Interquartile Range (IQR) | 4.7% | 8.7% |
| Standard Deviation (Sample) | 3.8% | 7.6% |
| Standard Deviation (Population) | 3.8% | 7.5% |
Similar Demographics by High School Diploma
Demographics Similar to Immigrants from Scotland by High School Diploma
In terms of high school diploma, the demographic groups most similar to Immigrants from Scotland are Immigrants from Ireland (91.3%, a difference of 0.020%), Dutch (91.3%, a difference of 0.020%), Immigrants from Lithuania (91.3%, a difference of 0.020%), Tsimshian (91.3%, a difference of 0.040%), and Immigrants from Australia (91.3%, a difference of 0.040%).
| Demographics | Rating | Rank | High School Diploma |
| Immigrants | Northern Europe | 99.9 /100 | #31 | Exceptional 91.4% |
| English | 99.9 /100 | #32 | Exceptional 91.4% |
| Okinawans | 99.9 /100 | #33 | Exceptional 91.4% |
| Scottish | 99.9 /100 | #34 | Exceptional 91.4% |
| Irish | 99.9 /100 | #35 | Exceptional 91.4% |
| Tsimshian | 99.9 /100 | #36 | Exceptional 91.3% |
| Immigrants | Ireland | 99.9 /100 | #37 | Exceptional 91.3% |
| Immigrants | Scotland | 99.8 /100 | #38 | Exceptional 91.3% |
| Dutch | 99.8 /100 | #39 | Exceptional 91.3% |
| Immigrants | Lithuania | 99.8 /100 | #40 | Exceptional 91.3% |
| Immigrants | Australia | 99.8 /100 | #41 | Exceptional 91.3% |
| Northern Europeans | 99.8 /100 | #42 | Exceptional 91.3% |
| British | 99.8 /100 | #43 | Exceptional 91.3% |
| Immigrants | Austria | 99.8 /100 | #44 | Exceptional 91.3% |
| Turks | 99.8 /100 | #45 | Exceptional 91.2% |
Demographics Similar to Immigrants from Belize by High School Diploma
In terms of high school diploma, the demographic groups most similar to Immigrants from Belize are Central American Indian (84.2%, a difference of 0.040%), Immigrants from Caribbean (84.3%, a difference of 0.070%), Belizean (84.3%, a difference of 0.13%), Nicaraguan (84.1%, a difference of 0.14%), and Yuman (84.0%, a difference of 0.27%).
| Demographics | Rating | Rank | High School Diploma |
| Ecuadorians | 0.0 /100 | #311 | Tragic 85.1% |
| Cape Verdeans | 0.0 /100 | #312 | Tragic 85.1% |
| Immigrants | Ecuador | 0.0 /100 | #313 | Tragic 84.8% |
| Yaqui | 0.0 /100 | #314 | Tragic 84.7% |
| Puerto Ricans | 0.0 /100 | #315 | Tragic 84.7% |
| Belizeans | 0.0 /100 | #316 | Tragic 84.3% |
| Immigrants | Caribbean | 0.0 /100 | #317 | Tragic 84.3% |
| Immigrants | Belize | 0.0 /100 | #318 | Tragic 84.2% |
| Central American Indians | 0.0 /100 | #319 | Tragic 84.2% |
| Nicaraguans | 0.0 /100 | #320 | Tragic 84.1% |
| Yuman | 0.0 /100 | #321 | Tragic 84.0% |
| Lumbee | 0.0 /100 | #322 | Tragic 83.6% |
| Immigrants | Cuba | 0.0 /100 | #323 | Tragic 83.5% |
| Immigrants | Cabo Verde | 0.0 /100 | #324 | Tragic 83.3% |
| Immigrants | Nicaragua | 0.0 /100 | #325 | Tragic 83.1% |