Pima vs German Russian Per Capita Income
COMPARE
Pima
German Russian
Per Capita Income
Per Capita Income Comparison
Pima
German Russians
$30,644
PER CAPITA INCOME
0.0/ 100
METRIC RATING
343rd/ 347
METRIC RANK
$40,266
PER CAPITA INCOME
2.2/ 100
METRIC RATING
243rd/ 347
METRIC RANK
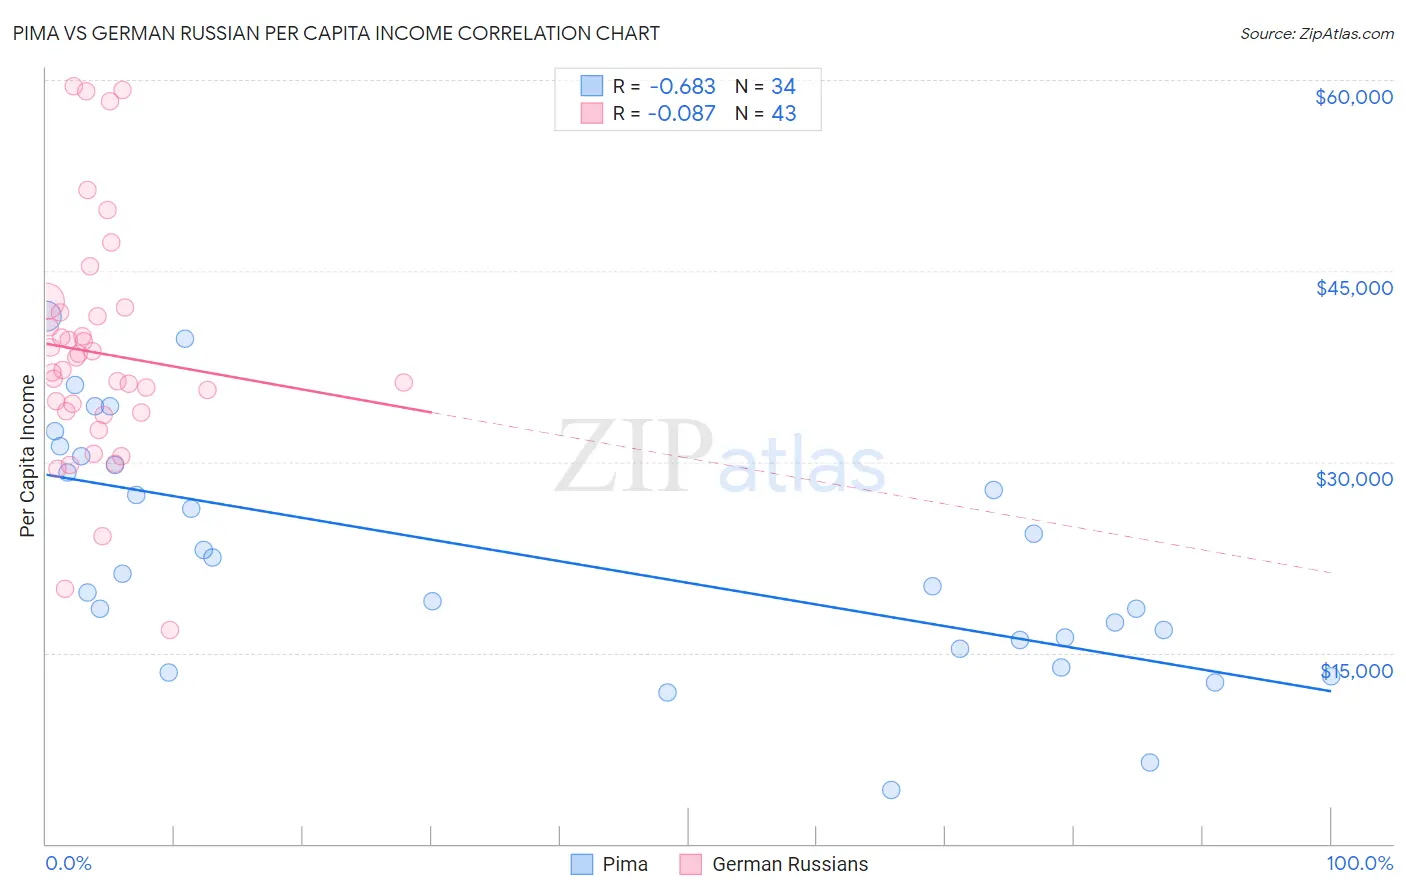
Pima vs German Russian Per Capita Income Correlation Chart
The statistical analysis conducted on geographies consisting of 61,552,682 people shows a significant negative correlation between the proportion of Pima and per capita income in the United States with a correlation coefficient (R) of -0.683 and weighted average of $30,644. Similarly, the statistical analysis conducted on geographies consisting of 96,461,984 people shows a slight negative correlation between the proportion of German Russians and per capita income in the United States with a correlation coefficient (R) of -0.087 and weighted average of $40,266, a difference of 31.4%.
Per Capita Income Correlation Summary
| Measurement | Pima | German Russian |
| Minimum | $4,256 | $16,776 |
| Maximum | $41,474 | $59,479 |
| Range | $37,218 | $42,703 |
| Mean | $22,491 | $38,536 |
| Median | $20,723 | $37,221 |
| Interquartile 25% (IQ1) | $16,036 | $33,912 |
| Interquartile 75% (IQ3) | $29,725 | $41,773 |
| Interquartile Range (IQR) | $13,689 | $7,861 |
| Standard Deviation (Sample) | $9,246 | $9,403 |
| Standard Deviation (Population) | $9,109 | $9,293 |
Similar Demographics by Per Capita Income
Demographics Similar to Pima by Per Capita Income
In terms of per capita income, the demographic groups most similar to Pima are Yup'ik ($30,518, a difference of 0.41%), Tohono O'odham ($30,256, a difference of 1.3%), Hopi ($31,177, a difference of 1.7%), Puerto Rican ($31,268, a difference of 2.0%), and Lumbee ($29,845, a difference of 2.7%).
| Demographics | Rating | Rank | Per Capita Income |
| Immigrants | Yemen | 0.0 /100 | #333 | Tragic $33,696 |
| Natives/Alaskans | 0.0 /100 | #334 | Tragic $33,279 |
| Yuman | 0.0 /100 | #335 | Tragic $33,236 |
| Yakama | 0.0 /100 | #336 | Tragic $33,009 |
| Houma | 0.0 /100 | #337 | Tragic $32,996 |
| Arapaho | 0.0 /100 | #338 | Tragic $32,345 |
| Pueblo | 0.0 /100 | #339 | Tragic $32,012 |
| Crow | 0.0 /100 | #340 | Tragic $31,729 |
| Puerto Ricans | 0.0 /100 | #341 | Tragic $31,268 |
| Hopi | 0.0 /100 | #342 | Tragic $31,177 |
| Pima | 0.0 /100 | #343 | Tragic $30,644 |
| Yup'ik | 0.0 /100 | #344 | Tragic $30,518 |
| Tohono O'odham | 0.0 /100 | #345 | Tragic $30,256 |
| Lumbee | 0.0 /100 | #346 | Tragic $29,845 |
| Navajo | 0.0 /100 | #347 | Tragic $29,031 |
Demographics Similar to German Russians by Per Capita Income
In terms of per capita income, the demographic groups most similar to German Russians are French American Indian ($40,244, a difference of 0.060%), Immigrants from Western Africa ($40,294, a difference of 0.070%), British West Indian ($40,330, a difference of 0.16%), Immigrants from Nigeria ($40,339, a difference of 0.18%), and Tsimshian ($40,344, a difference of 0.19%).
| Demographics | Rating | Rank | Per Capita Income |
| Immigrants | Nonimmigrants | 3.4 /100 | #236 | Tragic $40,669 |
| Immigrants | Cambodia | 2.6 /100 | #237 | Tragic $40,434 |
| Somalis | 2.4 /100 | #238 | Tragic $40,367 |
| Tsimshian | 2.4 /100 | #239 | Tragic $40,344 |
| Immigrants | Nigeria | 2.3 /100 | #240 | Tragic $40,339 |
| British West Indians | 2.3 /100 | #241 | Tragic $40,330 |
| Immigrants | Western Africa | 2.2 /100 | #242 | Tragic $40,294 |
| German Russians | 2.2 /100 | #243 | Tragic $40,266 |
| French American Indians | 2.1 /100 | #244 | Tragic $40,244 |
| Sub-Saharan Africans | 1.9 /100 | #245 | Tragic $40,152 |
| Cree | 1.7 /100 | #246 | Tragic $40,056 |
| Immigrants | Somalia | 1.6 /100 | #247 | Tragic $39,974 |
| Cape Verdeans | 1.5 /100 | #248 | Tragic $39,935 |
| Japanese | 1.4 /100 | #249 | Tragic $39,870 |
| Immigrants | Burma/Myanmar | 1.3 /100 | #250 | Tragic $39,827 |