Peruvian vs Kenyan Female Poverty Among 25-34 Year Olds
COMPARE
Peruvian
Kenyan
Female Poverty Among 25-34 Year Olds
Female Poverty Among 25-34 Year Olds Comparison
Peruvians
Kenyans
12.7%
FEMALE POVERTY AMONG 25-34 YEAR OLDS
95.6/ 100
METRIC RATING
102nd/ 347
METRIC RANK
13.5%
FEMALE POVERTY AMONG 25-34 YEAR OLDS
51.8/ 100
METRIC RATING
173rd/ 347
METRIC RANK
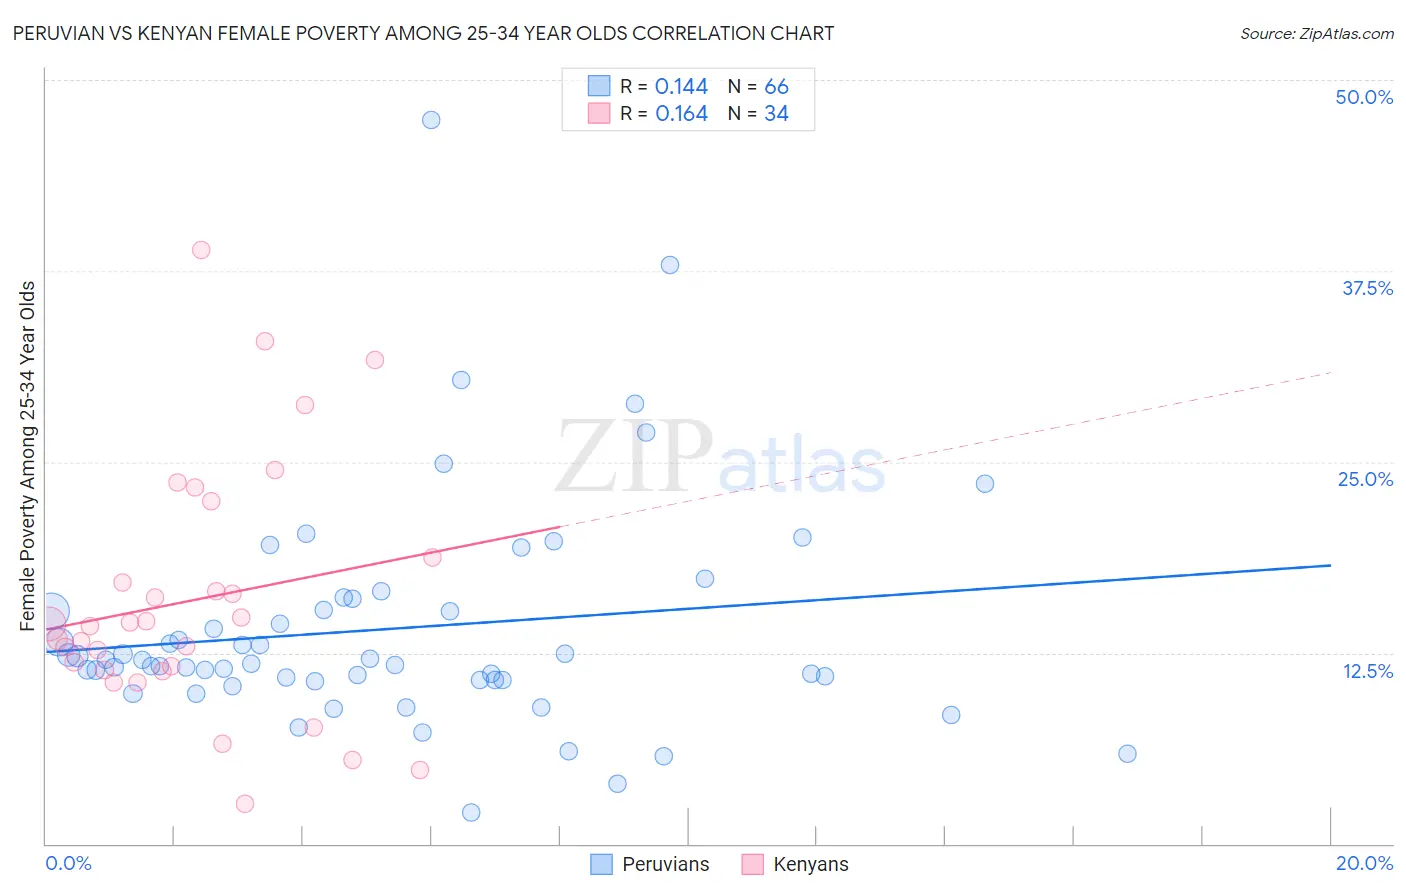
Peruvian vs Kenyan Female Poverty Among 25-34 Year Olds Correlation Chart
The statistical analysis conducted on geographies consisting of 358,420,954 people shows a poor positive correlation between the proportion of Peruvians and poverty level among females between the ages 25 and 34 in the United States with a correlation coefficient (R) of 0.144 and weighted average of 12.7%. Similarly, the statistical analysis conducted on geographies consisting of 167,556,876 people shows a poor positive correlation between the proportion of Kenyans and poverty level among females between the ages 25 and 34 in the United States with a correlation coefficient (R) of 0.164 and weighted average of 13.5%, a difference of 6.7%.
Female Poverty Among 25-34 Year Olds Correlation Summary
| Measurement | Peruvian | Kenyan |
| Minimum | 2.0% | 2.6% |
| Maximum | 47.4% | 38.8% |
| Range | 45.3% | 36.2% |
| Mean | 14.1% | 16.0% |
| Median | 11.9% | 14.3% |
| Interquartile 25% (IQ1) | 10.7% | 11.4% |
| Interquartile 75% (IQ3) | 15.3% | 18.8% |
| Interquartile Range (IQR) | 4.6% | 7.3% |
| Standard Deviation (Sample) | 7.4% | 8.2% |
| Standard Deviation (Population) | 7.4% | 8.1% |
Similar Demographics by Female Poverty Among 25-34 Year Olds
Demographics Similar to Peruvians by Female Poverty Among 25-34 Year Olds
In terms of female poverty among 25-34 year olds, the demographic groups most similar to Peruvians are Immigrants from Switzerland (12.7%, a difference of 0.060%), Immigrants from Spain (12.7%, a difference of 0.060%), Immigrants from Denmark (12.7%, a difference of 0.080%), Swedish (12.7%, a difference of 0.11%), and Immigrants from South Africa (12.7%, a difference of 0.16%).
| Demographics | Rating | Rank | Female Poverty Among 25-34 Year Olds |
| Ukrainians | 96.7 /100 | #95 | Exceptional 12.6% |
| Immigrants | Zimbabwe | 96.7 /100 | #96 | Exceptional 12.6% |
| Immigrants | Northern Africa | 96.6 /100 | #97 | Exceptional 12.6% |
| Immigrants | Ethiopia | 96.5 /100 | #98 | Exceptional 12.6% |
| Immigrants | Argentina | 96.4 /100 | #99 | Exceptional 12.6% |
| Immigrants | Denmark | 95.7 /100 | #100 | Exceptional 12.7% |
| Immigrants | Switzerland | 95.7 /100 | #101 | Exceptional 12.7% |
| Peruvians | 95.6 /100 | #102 | Exceptional 12.7% |
| Immigrants | Spain | 95.5 /100 | #103 | Exceptional 12.7% |
| Swedes | 95.4 /100 | #104 | Exceptional 12.7% |
| Immigrants | South Africa | 95.3 /100 | #105 | Exceptional 12.7% |
| Tsimshian | 95.1 /100 | #106 | Exceptional 12.7% |
| Poles | 94.9 /100 | #107 | Exceptional 12.7% |
| Immigrants | Norway | 94.4 /100 | #108 | Exceptional 12.7% |
| Immigrants | Peru | 94.3 /100 | #109 | Exceptional 12.7% |
Demographics Similar to Kenyans by Female Poverty Among 25-34 Year Olds
In terms of female poverty among 25-34 year olds, the demographic groups most similar to Kenyans are South American Indian (13.5%, a difference of 0.010%), Immigrants from Costa Rica (13.5%, a difference of 0.010%), Immigrants from Uganda (13.5%, a difference of 0.10%), Immigrants from Oceania (13.5%, a difference of 0.15%), and Bermudan (13.6%, a difference of 0.41%).
| Demographics | Rating | Rank | Female Poverty Among 25-34 Year Olds |
| Belgians | 58.9 /100 | #166 | Average 13.4% |
| Immigrants | Bosnia and Herzegovina | 58.6 /100 | #167 | Average 13.4% |
| Immigrants | Afghanistan | 57.7 /100 | #168 | Average 13.4% |
| Samoans | 56.8 /100 | #169 | Average 13.5% |
| Immigrants | Uganda | 53.0 /100 | #170 | Average 13.5% |
| South American Indians | 51.9 /100 | #171 | Average 13.5% |
| Immigrants | Costa Rica | 51.9 /100 | #172 | Average 13.5% |
| Kenyans | 51.8 /100 | #173 | Average 13.5% |
| Immigrants | Oceania | 50.0 /100 | #174 | Average 13.5% |
| Bermudans | 46.8 /100 | #175 | Average 13.6% |
| Yugoslavians | 45.0 /100 | #176 | Average 13.6% |
| Venezuelans | 44.6 /100 | #177 | Average 13.6% |
| Canadians | 44.3 /100 | #178 | Average 13.6% |
| Immigrants | Eastern Africa | 43.6 /100 | #179 | Average 13.6% |
| Germans | 41.6 /100 | #180 | Average 13.6% |