Peruvian vs Kenyan In Labor Force | Age 30-34
COMPARE
Peruvian
Kenyan
In Labor Force | Age 30-34
In Labor Force | Age 30-34 Comparison
Peruvians
Kenyans
84.8%
IN LABOR FORCE | AGE 30-34
65.9/ 100
METRIC RATING
157th/ 347
METRIC RANK
85.4%
IN LABOR FORCE | AGE 30-34
99.3/ 100
METRIC RATING
67th/ 347
METRIC RANK
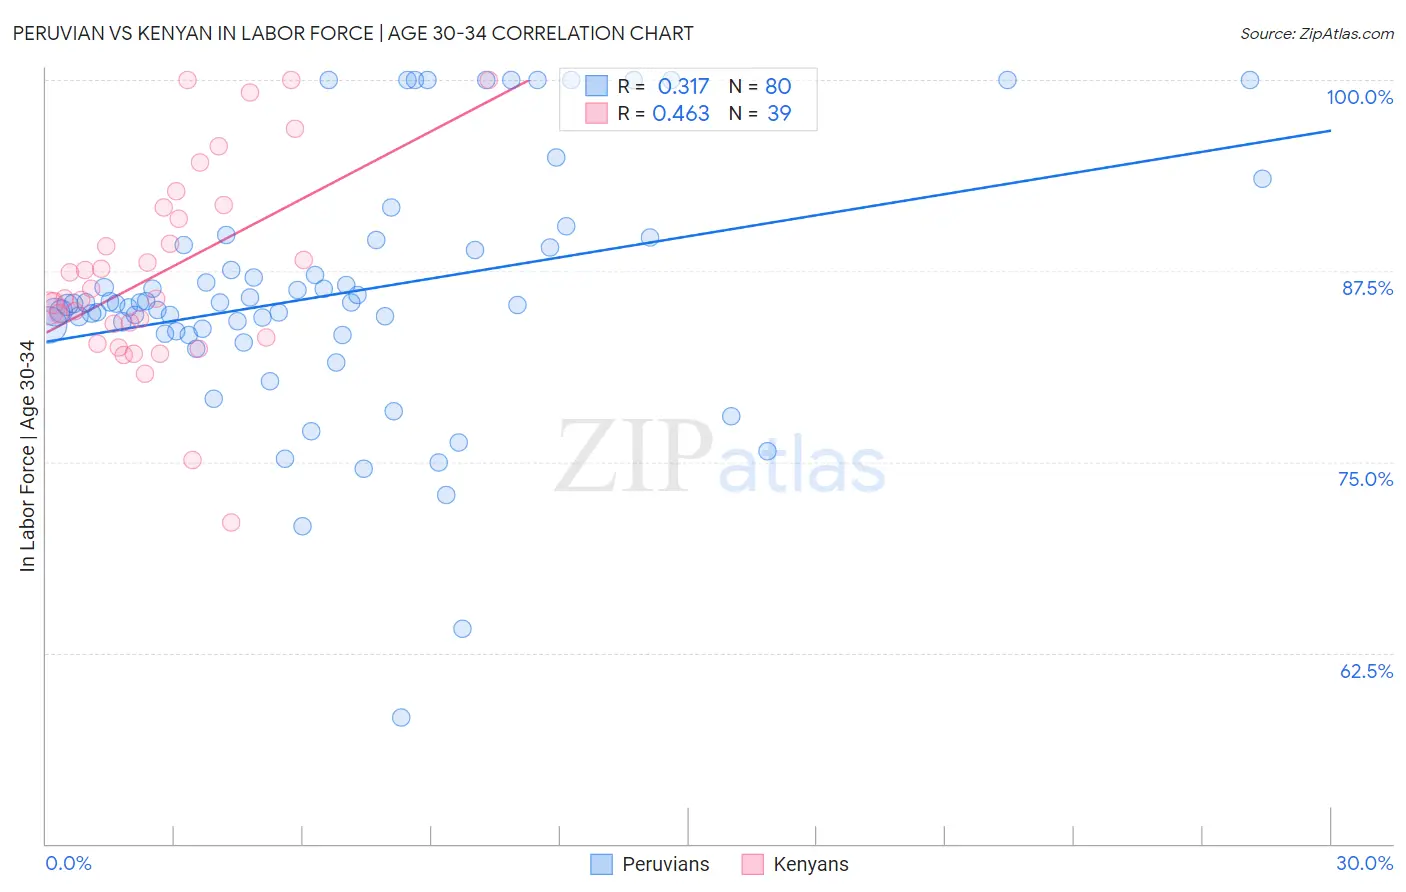
Peruvian vs Kenyan In Labor Force | Age 30-34 Correlation Chart
The statistical analysis conducted on geographies consisting of 363,011,511 people shows a mild positive correlation between the proportion of Peruvians and labor force participation rate among population between the ages 30 and 34 in the United States with a correlation coefficient (R) of 0.317 and weighted average of 84.8%. Similarly, the statistical analysis conducted on geographies consisting of 168,200,572 people shows a moderate positive correlation between the proportion of Kenyans and labor force participation rate among population between the ages 30 and 34 in the United States with a correlation coefficient (R) of 0.463 and weighted average of 85.4%, a difference of 0.77%.
In Labor Force | Age 30-34 Correlation Summary
| Measurement | Peruvian | Kenyan |
| Minimum | 58.3% | 71.0% |
| Maximum | 100.0% | 100.0% |
| Range | 41.7% | 29.0% |
| Mean | 86.0% | 87.4% |
| Median | 85.3% | 85.7% |
| Interquartile 25% (IQ1) | 83.5% | 83.1% |
| Interquartile 75% (IQ3) | 89.1% | 91.6% |
| Interquartile Range (IQR) | 5.6% | 8.5% |
| Standard Deviation (Sample) | 8.1% | 6.5% |
| Standard Deviation (Population) | 8.1% | 6.4% |
Similar Demographics by In Labor Force | Age 30-34
Demographics Similar to Peruvians by In Labor Force | Age 30-34
In terms of in labor force | age 30-34, the demographic groups most similar to Peruvians are French Canadian (84.8%, a difference of 0.010%), Immigrants from Armenia (84.8%, a difference of 0.010%), Czechoslovakian (84.8%, a difference of 0.020%), Syrian (84.8%, a difference of 0.030%), and Northern European (84.8%, a difference of 0.030%).
| Demographics | Rating | Rank | In Labor Force | Age 30-34 |
| Germans | 75.1 /100 | #150 | Good 84.8% |
| Immigrants | Senegal | 74.0 /100 | #151 | Good 84.8% |
| Romanians | 73.5 /100 | #152 | Good 84.8% |
| Syrians | 70.1 /100 | #153 | Good 84.8% |
| Northern Europeans | 70.0 /100 | #154 | Good 84.8% |
| Immigrants | Sudan | 69.5 /100 | #155 | Good 84.8% |
| French Canadians | 67.3 /100 | #156 | Good 84.8% |
| Peruvians | 65.9 /100 | #157 | Good 84.8% |
| Immigrants | Armenia | 64.7 /100 | #158 | Good 84.8% |
| Czechoslovakians | 63.0 /100 | #159 | Good 84.8% |
| Pakistanis | 60.8 /100 | #160 | Good 84.7% |
| Immigrants | Cambodia | 60.7 /100 | #161 | Good 84.7% |
| South Americans | 58.7 /100 | #162 | Average 84.7% |
| Immigrants | Uruguay | 57.4 /100 | #163 | Average 84.7% |
| Icelanders | 56.8 /100 | #164 | Average 84.7% |
Demographics Similar to Kenyans by In Labor Force | Age 30-34
In terms of in labor force | age 30-34, the demographic groups most similar to Kenyans are Ghanaian (85.4%, a difference of 0.0%), Senegalese (85.4%, a difference of 0.010%), Immigrants from Eastern Europe (85.4%, a difference of 0.010%), Italian (85.4%, a difference of 0.020%), and Soviet Union (85.5%, a difference of 0.030%).
| Demographics | Rating | Rank | In Labor Force | Age 30-34 |
| Immigrants | France | 99.5 /100 | #60 | Exceptional 85.5% |
| Immigrants | Brazil | 99.5 /100 | #61 | Exceptional 85.5% |
| Soviet Union | 99.4 /100 | #62 | Exceptional 85.5% |
| Macedonians | 99.4 /100 | #63 | Exceptional 85.5% |
| Italians | 99.4 /100 | #64 | Exceptional 85.4% |
| Senegalese | 99.4 /100 | #65 | Exceptional 85.4% |
| Ghanaians | 99.4 /100 | #66 | Exceptional 85.4% |
| Kenyans | 99.3 /100 | #67 | Exceptional 85.4% |
| Immigrants | Eastern Europe | 99.3 /100 | #68 | Exceptional 85.4% |
| Immigrants | Iran | 99.2 /100 | #69 | Exceptional 85.4% |
| Brazilians | 99.1 /100 | #70 | Exceptional 85.4% |
| Immigrants | Japan | 99.1 /100 | #71 | Exceptional 85.4% |
| Immigrants | China | 99.0 /100 | #72 | Exceptional 85.4% |
| Indians (Asian) | 99.0 /100 | #73 | Exceptional 85.4% |
| Maltese | 99.0 /100 | #74 | Exceptional 85.4% |