Immigrants from Afghanistan vs Kenyan 10th Grade
COMPARE
Immigrants from Afghanistan
Kenyan
10th Grade
10th Grade Comparison
Immigrants from Afghanistan
Kenyans
92.8%
10TH GRADE
1.4/ 100
METRIC RATING
247th/ 347
METRIC RANK
94.0%
10TH GRADE
79.1/ 100
METRIC RATING
151st/ 347
METRIC RANK
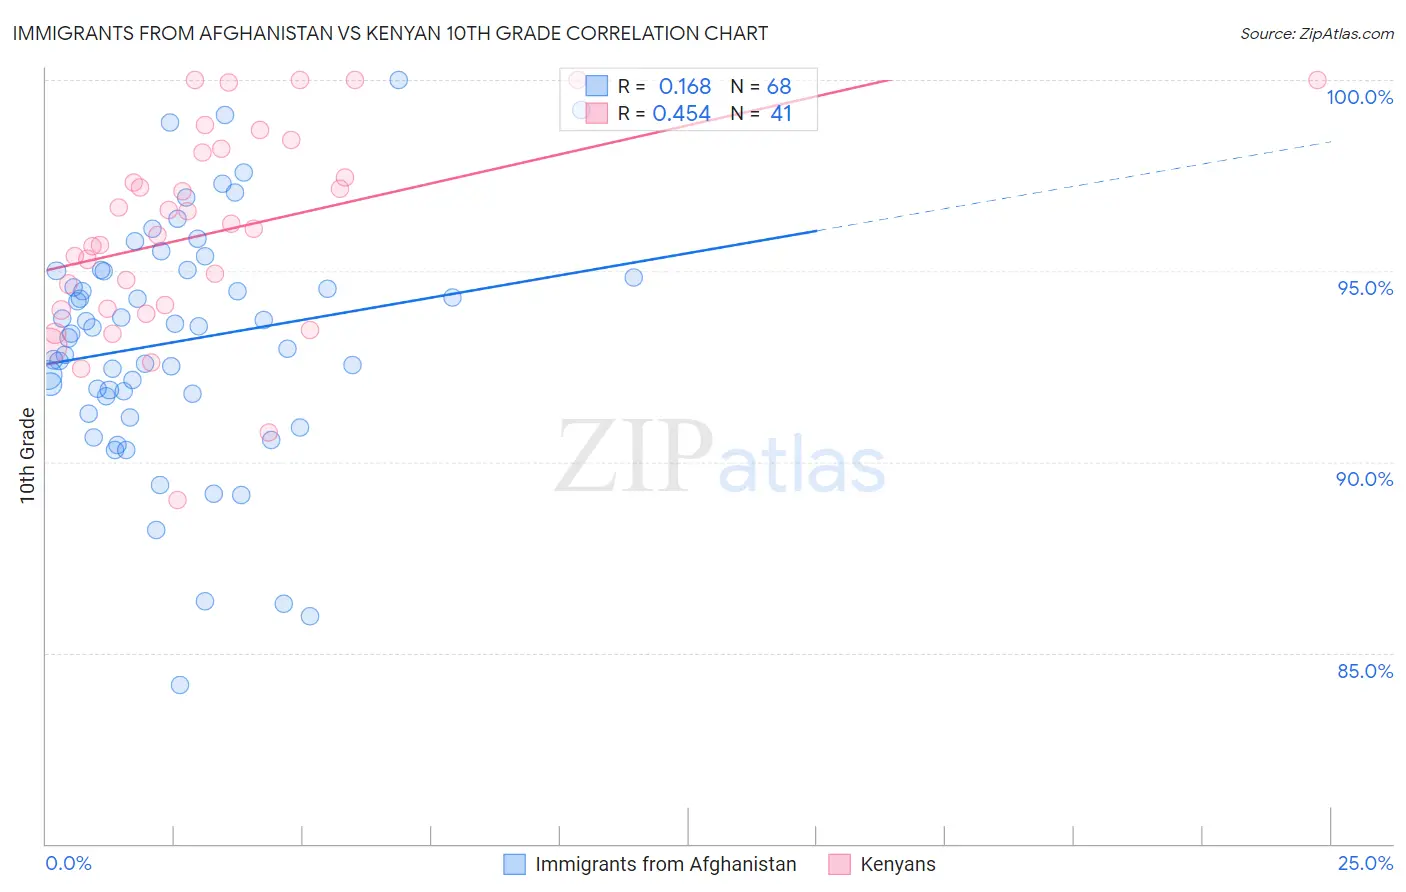
Immigrants from Afghanistan vs Kenyan 10th Grade Correlation Chart
The statistical analysis conducted on geographies consisting of 147,629,924 people shows a poor positive correlation between the proportion of Immigrants from Afghanistan and percentage of population with at least 10th grade education in the United States with a correlation coefficient (R) of 0.168 and weighted average of 92.8%. Similarly, the statistical analysis conducted on geographies consisting of 168,244,042 people shows a moderate positive correlation between the proportion of Kenyans and percentage of population with at least 10th grade education in the United States with a correlation coefficient (R) of 0.454 and weighted average of 94.0%, a difference of 1.3%.
10th Grade Correlation Summary
| Measurement | Immigrants from Afghanistan | Kenyan |
| Minimum | 84.2% | 89.0% |
| Maximum | 100.0% | 100.0% |
| Range | 15.8% | 11.0% |
| Mean | 93.2% | 96.0% |
| Median | 93.4% | 96.1% |
| Interquartile 25% (IQ1) | 91.7% | 94.0% |
| Interquartile 75% (IQ3) | 95.0% | 98.2% |
| Interquartile Range (IQR) | 3.3% | 4.2% |
| Standard Deviation (Sample) | 3.1% | 2.7% |
| Standard Deviation (Population) | 3.1% | 2.6% |
Similar Demographics by 10th Grade
Demographics Similar to Immigrants from Afghanistan by 10th Grade
In terms of 10th grade, the demographic groups most similar to Immigrants from Afghanistan are Colombian (92.8%, a difference of 0.010%), Immigrants from Senegal (92.8%, a difference of 0.010%), Immigrants from Middle Africa (92.9%, a difference of 0.040%), Jamaican (92.8%, a difference of 0.040%), and Uruguayan (92.9%, a difference of 0.060%).
| Demographics | Rating | Rank | 10th Grade |
| Immigrants | Hong Kong | 4.2 /100 | #240 | Tragic 93.1% |
| Immigrants | Somalia | 2.7 /100 | #241 | Tragic 93.0% |
| Immigrants | Cameroon | 2.6 /100 | #242 | Tragic 93.0% |
| Senegalese | 2.4 /100 | #243 | Tragic 93.0% |
| Spanish Americans | 2.1 /100 | #244 | Tragic 92.9% |
| Uruguayans | 1.8 /100 | #245 | Tragic 92.9% |
| Immigrants | Middle Africa | 1.7 /100 | #246 | Tragic 92.9% |
| Immigrants | Afghanistan | 1.4 /100 | #247 | Tragic 92.8% |
| Colombians | 1.4 /100 | #248 | Tragic 92.8% |
| Immigrants | Senegal | 1.4 /100 | #249 | Tragic 92.8% |
| Jamaicans | 1.2 /100 | #250 | Tragic 92.8% |
| Immigrants | Thailand | 1.0 /100 | #251 | Tragic 92.8% |
| South Americans | 0.9 /100 | #252 | Tragic 92.8% |
| Ghanaians | 0.9 /100 | #253 | Tragic 92.8% |
| Armenians | 0.9 /100 | #254 | Tragic 92.7% |
Demographics Similar to Kenyans by 10th Grade
In terms of 10th grade, the demographic groups most similar to Kenyans are Egyptian (94.0%, a difference of 0.010%), Immigrants from Italy (94.0%, a difference of 0.010%), Ugandan (94.0%, a difference of 0.020%), Immigrants from Ukraine (94.0%, a difference of 0.030%), and Arab (94.0%, a difference of 0.030%).
| Demographics | Rating | Rank | 10th Grade |
| Immigrants | Kazakhstan | 84.9 /100 | #144 | Excellent 94.1% |
| Immigrants | Nonimmigrants | 83.8 /100 | #145 | Excellent 94.1% |
| Chickasaw | 82.6 /100 | #146 | Excellent 94.1% |
| Immigrants | Ukraine | 81.5 /100 | #147 | Excellent 94.0% |
| Arabs | 80.9 /100 | #148 | Excellent 94.0% |
| Ugandans | 80.7 /100 | #149 | Excellent 94.0% |
| Egyptians | 79.6 /100 | #150 | Good 94.0% |
| Kenyans | 79.1 /100 | #151 | Good 94.0% |
| Immigrants | Italy | 78.0 /100 | #152 | Good 94.0% |
| Immigrants | Brazil | 75.5 /100 | #153 | Good 94.0% |
| Immigrants | Kenya | 75.3 /100 | #154 | Good 94.0% |
| Spanish | 74.9 /100 | #155 | Good 94.0% |
| Mongolians | 74.4 /100 | #156 | Good 94.0% |
| Kiowa | 73.3 /100 | #157 | Good 93.9% |
| Bermudans | 71.0 /100 | #158 | Good 93.9% |