Peruvian vs Immigrants from Kenya 8th Grade
COMPARE
Peruvian
Immigrants from Kenya
8th Grade
8th Grade Comparison
Peruvians
Immigrants from Kenya
94.7%
8TH GRADE
0.1/ 100
METRIC RATING
276th/ 347
METRIC RANK
95.8%
8TH GRADE
67.2/ 100
METRIC RATING
162nd/ 347
METRIC RANK
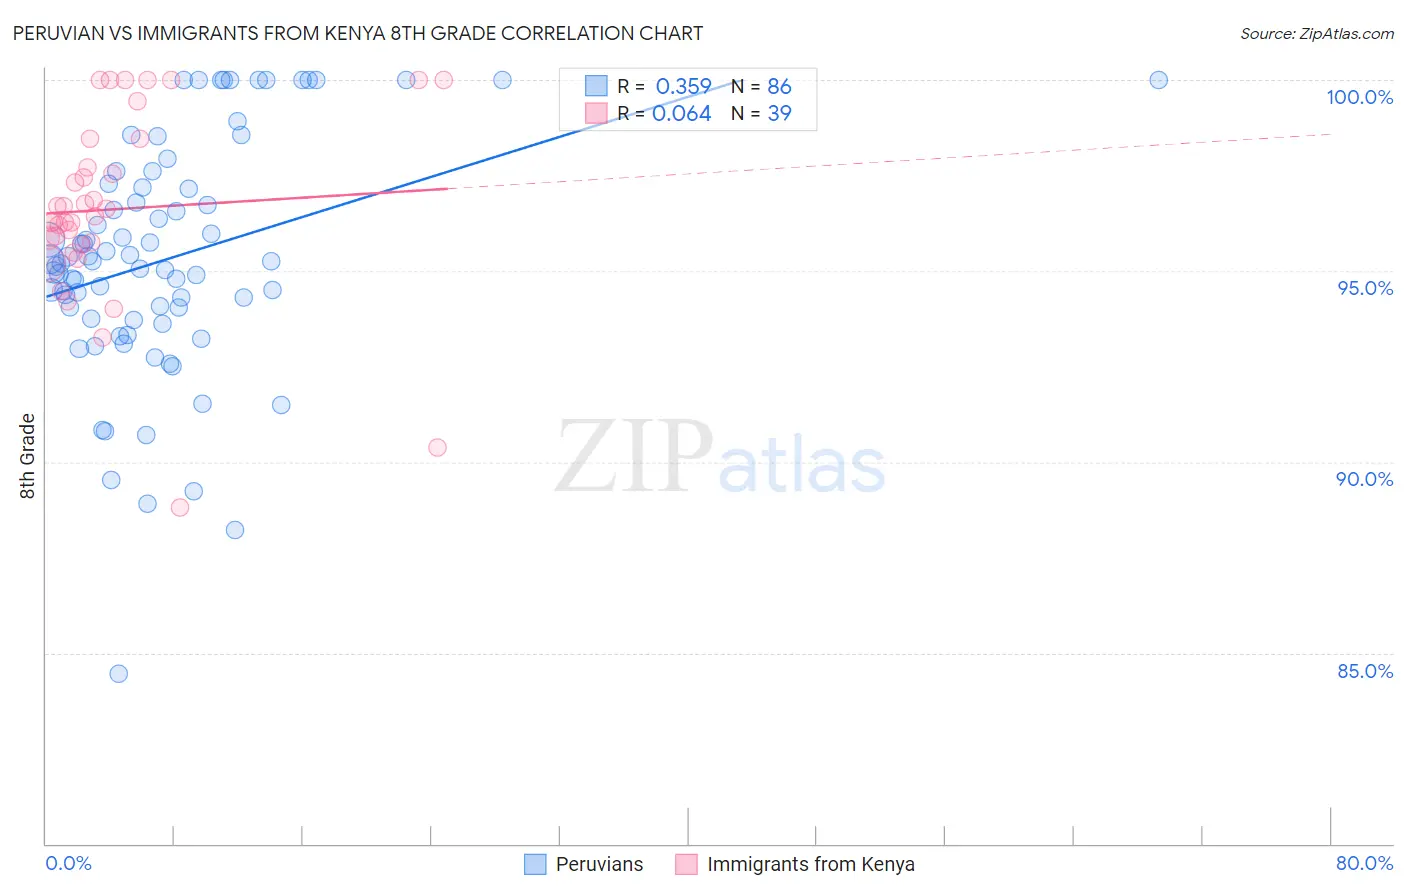
Peruvian vs Immigrants from Kenya 8th Grade Correlation Chart
The statistical analysis conducted on geographies consisting of 363,251,075 people shows a mild positive correlation between the proportion of Peruvians and percentage of population with at least 8th grade education in the United States with a correlation coefficient (R) of 0.359 and weighted average of 94.7%. Similarly, the statistical analysis conducted on geographies consisting of 218,076,690 people shows a slight positive correlation between the proportion of Immigrants from Kenya and percentage of population with at least 8th grade education in the United States with a correlation coefficient (R) of 0.064 and weighted average of 95.8%, a difference of 1.2%.
8th Grade Correlation Summary
| Measurement | Peruvian | Immigrants from Kenya |
| Minimum | 84.4% | 88.8% |
| Maximum | 100.0% | 100.0% |
| Range | 15.6% | 11.2% |
| Mean | 95.3% | 96.6% |
| Median | 95.2% | 96.4% |
| Interquartile 25% (IQ1) | 93.8% | 95.7% |
| Interquartile 75% (IQ3) | 97.2% | 98.5% |
| Interquartile Range (IQR) | 3.4% | 2.8% |
| Standard Deviation (Sample) | 3.1% | 2.5% |
| Standard Deviation (Population) | 3.1% | 2.5% |
Similar Demographics by 8th Grade
Demographics Similar to Peruvians by 8th Grade
In terms of 8th grade, the demographic groups most similar to Peruvians are Immigrants from Colombia (94.7%, a difference of 0.030%), Taiwanese (94.7%, a difference of 0.030%), Trinidadian and Tobagonian (94.7%, a difference of 0.040%), Immigrants from Western Africa (94.8%, a difference of 0.050%), and Immigrants from South America (94.8%, a difference of 0.060%).
| Demographics | Rating | Rank | 8th Grade |
| Immigrants | Thailand | 0.2 /100 | #269 | Tragic 94.8% |
| Immigrants | Uzbekistan | 0.2 /100 | #270 | Tragic 94.8% |
| Immigrants | Afghanistan | 0.2 /100 | #271 | Tragic 94.8% |
| Immigrants | South America | 0.2 /100 | #272 | Tragic 94.8% |
| Immigrants | Western Africa | 0.2 /100 | #273 | Tragic 94.8% |
| Trinidadians and Tobagonians | 0.2 /100 | #274 | Tragic 94.7% |
| Immigrants | Colombia | 0.2 /100 | #275 | Tragic 94.7% |
| Peruvians | 0.1 /100 | #276 | Tragic 94.7% |
| Taiwanese | 0.1 /100 | #277 | Tragic 94.7% |
| Armenians | 0.1 /100 | #278 | Tragic 94.7% |
| Immigrants | Trinidad and Tobago | 0.1 /100 | #279 | Tragic 94.6% |
| Barbadians | 0.1 /100 | #280 | Tragic 94.6% |
| Immigrants | Bolivia | 0.1 /100 | #281 | Tragic 94.6% |
| Immigrants | Eritrea | 0.1 /100 | #282 | Tragic 94.6% |
| Immigrants | St. Vincent and the Grenadines | 0.1 /100 | #283 | Tragic 94.6% |
Demographics Similar to Immigrants from Kenya by 8th Grade
In terms of 8th grade, the demographic groups most similar to Immigrants from Kenya are Seminole (95.8%, a difference of 0.0%), Bermudan (95.8%, a difference of 0.0%), Immigrants from Kazakhstan (95.9%, a difference of 0.010%), Arab (95.9%, a difference of 0.020%), and Immigrants from Sri Lanka (95.8%, a difference of 0.020%).
| Demographics | Rating | Rank | 8th Grade |
| Kenyans | 74.5 /100 | #155 | Good 95.9% |
| Ugandans | 74.1 /100 | #156 | Good 95.9% |
| Immigrants | Taiwan | 70.5 /100 | #157 | Good 95.9% |
| Arabs | 69.4 /100 | #158 | Good 95.9% |
| Immigrants | Kazakhstan | 68.4 /100 | #159 | Good 95.9% |
| Seminole | 67.7 /100 | #160 | Good 95.8% |
| Bermudans | 67.5 /100 | #161 | Good 95.8% |
| Immigrants | Kenya | 67.2 /100 | #162 | Good 95.8% |
| Immigrants | Sri Lanka | 64.1 /100 | #163 | Good 95.8% |
| Immigrants | Italy | 63.5 /100 | #164 | Good 95.8% |
| Alsatians | 61.4 /100 | #165 | Good 95.8% |
| Immigrants | Poland | 61.1 /100 | #166 | Good 95.8% |
| Spaniards | 60.0 /100 | #167 | Good 95.8% |
| Immigrants | Ukraine | 59.5 /100 | #168 | Average 95.8% |
| Immigrants | Iran | 58.6 /100 | #169 | Average 95.8% |