Peruvian vs Tsimshian 7th Grade
COMPARE
Peruvian
Tsimshian
7th Grade
7th Grade Comparison
Peruvians
Tsimshian
95.1%
7TH GRADE
0.2/ 100
METRIC RATING
272nd/ 347
METRIC RANK
97.8%
7TH GRADE
100.0/ 100
METRIC RATING
6th/ 347
METRIC RANK
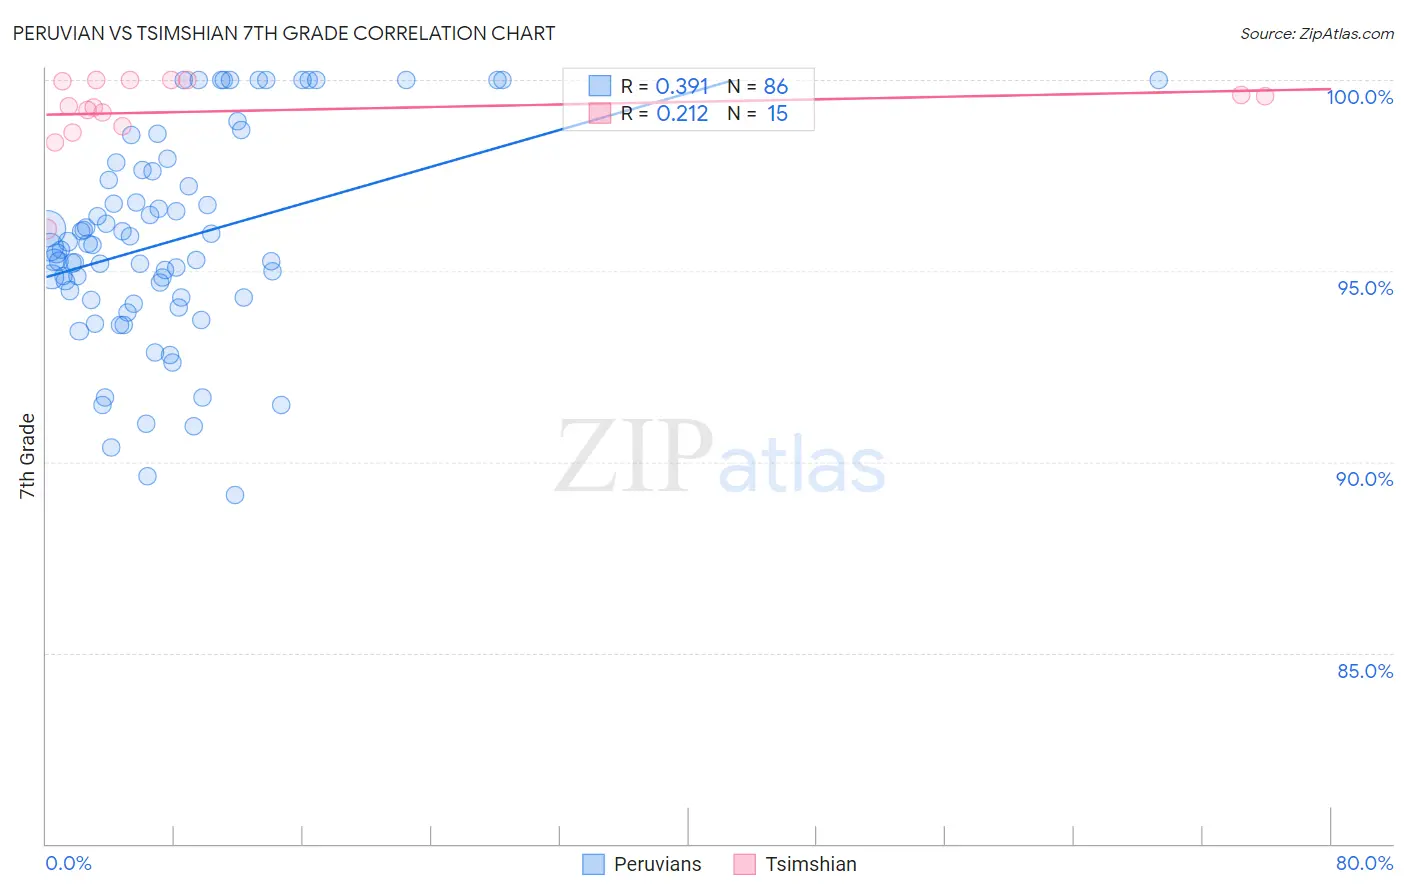
Peruvian vs Tsimshian 7th Grade Correlation Chart
The statistical analysis conducted on geographies consisting of 363,068,462 people shows a mild positive correlation between the proportion of Peruvians and percentage of population with at least 7th grade education in the United States with a correlation coefficient (R) of 0.391 and weighted average of 95.1%. Similarly, the statistical analysis conducted on geographies consisting of 15,626,544 people shows a weak positive correlation between the proportion of Tsimshian and percentage of population with at least 7th grade education in the United States with a correlation coefficient (R) of 0.212 and weighted average of 97.8%, a difference of 2.8%.
7th Grade Correlation Summary
| Measurement | Peruvian | Tsimshian |
| Minimum | 89.1% | 96.1% |
| Maximum | 100.0% | 100.0% |
| Range | 10.9% | 3.9% |
| Mean | 95.8% | 99.2% |
| Median | 95.6% | 99.3% |
| Interquartile 25% (IQ1) | 94.3% | 98.8% |
| Interquartile 75% (IQ3) | 97.6% | 100.0% |
| Interquartile Range (IQR) | 3.3% | 1.2% |
| Standard Deviation (Sample) | 2.7% | 1.0% |
| Standard Deviation (Population) | 2.7% | 0.97% |
Similar Demographics by 7th Grade
Demographics Similar to Peruvians by 7th Grade
In terms of 7th grade, the demographic groups most similar to Peruvians are Houma (95.1%, a difference of 0.0%), Immigrants from South America (95.1%, a difference of 0.0%), Immigrants from Uzbekistan (95.1%, a difference of 0.0%), Immigrants from Western Africa (95.1%, a difference of 0.010%), and Immigrants from Colombia (95.1%, a difference of 0.010%).
| Demographics | Rating | Rank | 7th Grade |
| Immigrants | Uruguay | 0.3 /100 | #265 | Tragic 95.2% |
| Immigrants | Ghana | 0.3 /100 | #266 | Tragic 95.2% |
| Yuman | 0.3 /100 | #267 | Tragic 95.2% |
| Immigrants | Hong Kong | 0.3 /100 | #268 | Tragic 95.2% |
| Trinidadians and Tobagonians | 0.3 /100 | #269 | Tragic 95.2% |
| Houma | 0.2 /100 | #270 | Tragic 95.1% |
| Immigrants | South America | 0.2 /100 | #271 | Tragic 95.1% |
| Peruvians | 0.2 /100 | #272 | Tragic 95.1% |
| Immigrants | Uzbekistan | 0.2 /100 | #273 | Tragic 95.1% |
| Immigrants | Western Africa | 0.2 /100 | #274 | Tragic 95.1% |
| Immigrants | Colombia | 0.2 /100 | #275 | Tragic 95.1% |
| Immigrants | Thailand | 0.2 /100 | #276 | Tragic 95.1% |
| Immigrants | Afghanistan | 0.2 /100 | #277 | Tragic 95.1% |
| Immigrants | Trinidad and Tobago | 0.1 /100 | #278 | Tragic 95.1% |
| Barbadians | 0.1 /100 | #279 | Tragic 95.1% |
Demographics Similar to Tsimshian by 7th Grade
In terms of 7th grade, the demographic groups most similar to Tsimshian are Norwegian (97.8%, a difference of 0.030%), Slovak (97.8%, a difference of 0.040%), Dutch (97.9%, a difference of 0.060%), German (97.7%, a difference of 0.060%), and Slovene (97.6%, a difference of 0.16%).
| Demographics | Rating | Rank | 7th Grade |
| Crow | 100.0 /100 | #1 | Exceptional 99.1% |
| Finns | 100.0 /100 | #2 | Exceptional 98.5% |
| Carpatho Rusyns | 100.0 /100 | #3 | Exceptional 98.3% |
| Ottawa | 100.0 /100 | #4 | Exceptional 98.1% |
| Dutch | 100.0 /100 | #5 | Exceptional 97.9% |
| Tsimshian | 100.0 /100 | #6 | Exceptional 97.8% |
| Norwegians | 100.0 /100 | #7 | Exceptional 97.8% |
| Slovaks | 100.0 /100 | #8 | Exceptional 97.8% |
| Germans | 100.0 /100 | #9 | Exceptional 97.7% |
| Slovenes | 100.0 /100 | #10 | Exceptional 97.6% |
| Alaskan Athabascans | 100.0 /100 | #11 | Exceptional 97.6% |
| Poles | 100.0 /100 | #12 | Exceptional 97.6% |
| Swedes | 100.0 /100 | #13 | Exceptional 97.6% |
| Pennsylvania Germans | 100.0 /100 | #14 | Exceptional 97.6% |
| English | 100.0 /100 | #15 | Exceptional 97.6% |