Peruvian vs Immigrants from Eastern Asia 7th Grade
COMPARE
Peruvian
Immigrants from Eastern Asia
7th Grade
7th Grade Comparison
Peruvians
Immigrants from Eastern Asia
95.1%
7TH GRADE
0.2/ 100
METRIC RATING
272nd/ 347
METRIC RANK
95.6%
7TH GRADE
5.8/ 100
METRIC RATING
226th/ 347
METRIC RANK
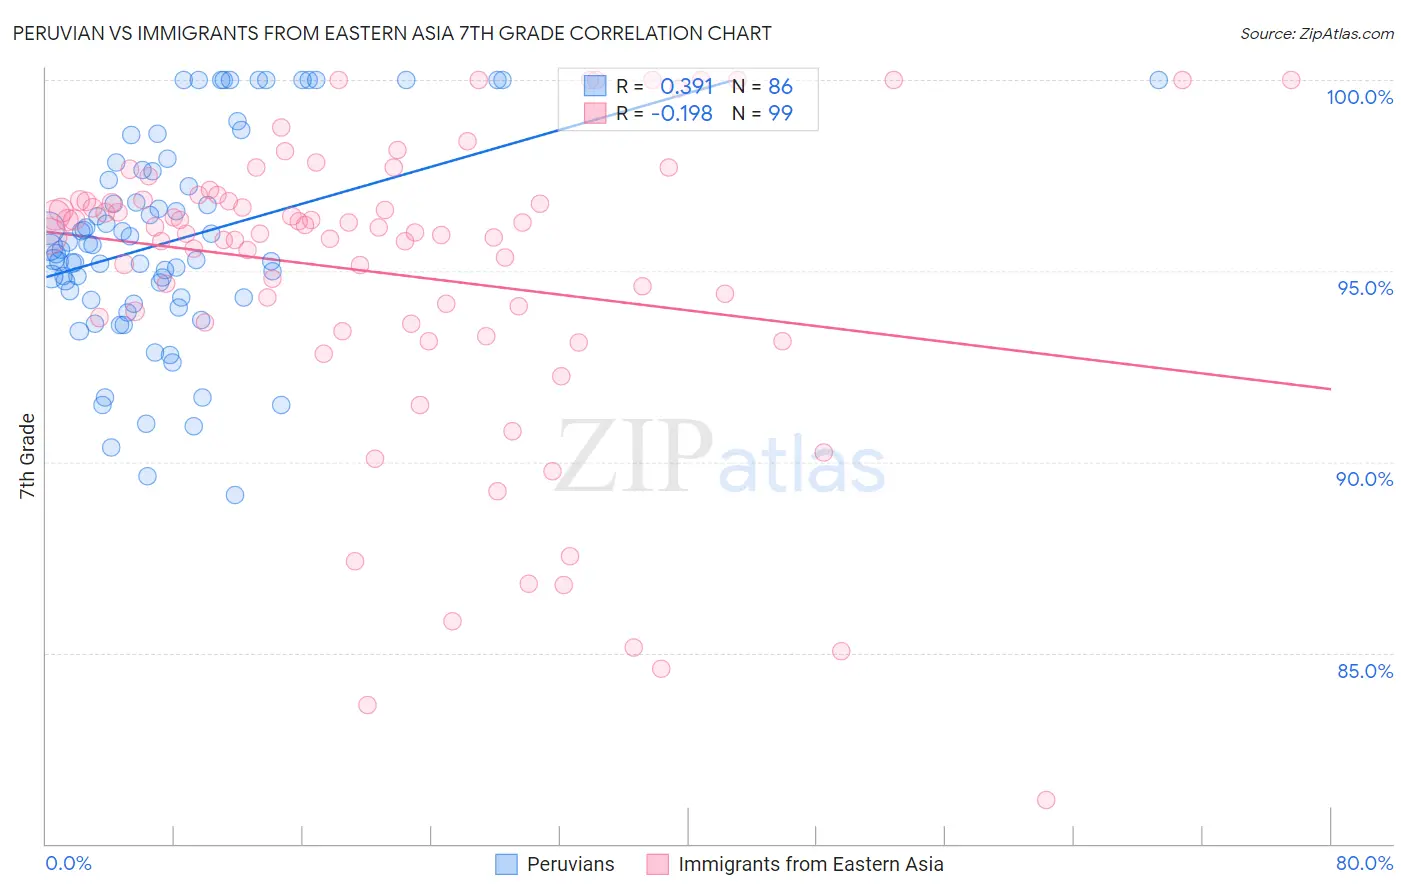
Peruvian vs Immigrants from Eastern Asia 7th Grade Correlation Chart
The statistical analysis conducted on geographies consisting of 363,068,462 people shows a mild positive correlation between the proportion of Peruvians and percentage of population with at least 7th grade education in the United States with a correlation coefficient (R) of 0.391 and weighted average of 95.1%. Similarly, the statistical analysis conducted on geographies consisting of 499,846,352 people shows a poor negative correlation between the proportion of Immigrants from Eastern Asia and percentage of population with at least 7th grade education in the United States with a correlation coefficient (R) of -0.198 and weighted average of 95.6%, a difference of 0.52%.
7th Grade Correlation Summary
| Measurement | Peruvian | Immigrants from Eastern Asia |
| Minimum | 89.1% | 81.1% |
| Maximum | 100.0% | 100.0% |
| Range | 10.9% | 18.9% |
| Mean | 95.8% | 94.9% |
| Median | 95.6% | 96.0% |
| Interquartile 25% (IQ1) | 94.3% | 93.7% |
| Interquartile 75% (IQ3) | 97.6% | 96.9% |
| Interquartile Range (IQR) | 3.3% | 3.2% |
| Standard Deviation (Sample) | 2.7% | 4.0% |
| Standard Deviation (Population) | 2.7% | 4.0% |
Similar Demographics by 7th Grade
Demographics Similar to Peruvians by 7th Grade
In terms of 7th grade, the demographic groups most similar to Peruvians are Houma (95.1%, a difference of 0.0%), Immigrants from South America (95.1%, a difference of 0.0%), Immigrants from Uzbekistan (95.1%, a difference of 0.0%), Immigrants from Western Africa (95.1%, a difference of 0.010%), and Immigrants from Colombia (95.1%, a difference of 0.010%).
| Demographics | Rating | Rank | 7th Grade |
| Immigrants | Uruguay | 0.3 /100 | #265 | Tragic 95.2% |
| Immigrants | Ghana | 0.3 /100 | #266 | Tragic 95.2% |
| Yuman | 0.3 /100 | #267 | Tragic 95.2% |
| Immigrants | Hong Kong | 0.3 /100 | #268 | Tragic 95.2% |
| Trinidadians and Tobagonians | 0.3 /100 | #269 | Tragic 95.2% |
| Houma | 0.2 /100 | #270 | Tragic 95.1% |
| Immigrants | South America | 0.2 /100 | #271 | Tragic 95.1% |
| Peruvians | 0.2 /100 | #272 | Tragic 95.1% |
| Immigrants | Uzbekistan | 0.2 /100 | #273 | Tragic 95.1% |
| Immigrants | Western Africa | 0.2 /100 | #274 | Tragic 95.1% |
| Immigrants | Colombia | 0.2 /100 | #275 | Tragic 95.1% |
| Immigrants | Thailand | 0.2 /100 | #276 | Tragic 95.1% |
| Immigrants | Afghanistan | 0.2 /100 | #277 | Tragic 95.1% |
| Immigrants | Trinidad and Tobago | 0.1 /100 | #278 | Tragic 95.1% |
| Barbadians | 0.1 /100 | #279 | Tragic 95.1% |
Demographics Similar to Immigrants from Eastern Asia by 7th Grade
In terms of 7th grade, the demographic groups most similar to Immigrants from Eastern Asia are Immigrants from Malaysia (95.6%, a difference of 0.010%), Immigrants from Western Asia (95.6%, a difference of 0.010%), Immigrants from Syria (95.7%, a difference of 0.020%), Immigrants from Oceania (95.7%, a difference of 0.020%), and Immigrants from Eastern Africa (95.6%, a difference of 0.020%).
| Demographics | Rating | Rank | 7th Grade |
| Immigrants | Southern Europe | 7.9 /100 | #219 | Tragic 95.7% |
| Sub-Saharan Africans | 7.2 /100 | #220 | Tragic 95.7% |
| Samoans | 7.0 /100 | #221 | Tragic 95.7% |
| Laotians | 6.8 /100 | #222 | Tragic 95.7% |
| Immigrants | Syria | 6.7 /100 | #223 | Tragic 95.7% |
| Immigrants | Oceania | 6.7 /100 | #224 | Tragic 95.7% |
| Immigrants | Malaysia | 6.2 /100 | #225 | Tragic 95.6% |
| Immigrants | Eastern Asia | 5.8 /100 | #226 | Tragic 95.6% |
| Immigrants | Western Asia | 5.4 /100 | #227 | Tragic 95.6% |
| Immigrants | Eastern Africa | 5.1 /100 | #228 | Tragic 95.6% |
| Immigrants | Panama | 4.9 /100 | #229 | Tragic 95.6% |
| Natives/Alaskans | 4.2 /100 | #230 | Tragic 95.6% |
| Senegalese | 4.0 /100 | #231 | Tragic 95.6% |
| Costa Ricans | 3.3 /100 | #232 | Tragic 95.5% |
| Immigrants | Indonesia | 3.3 /100 | #233 | Tragic 95.5% |