Peruvian vs Immigrants from Eastern Asia 3rd Grade
COMPARE
Peruvian
Immigrants from Eastern Asia
3rd Grade
3rd Grade Comparison
Peruvians
Immigrants from Eastern Asia
97.4%
3RD GRADE
0.8/ 100
METRIC RATING
252nd/ 347
METRIC RANK
97.4%
3RD GRADE
1.9/ 100
METRIC RATING
234th/ 347
METRIC RANK
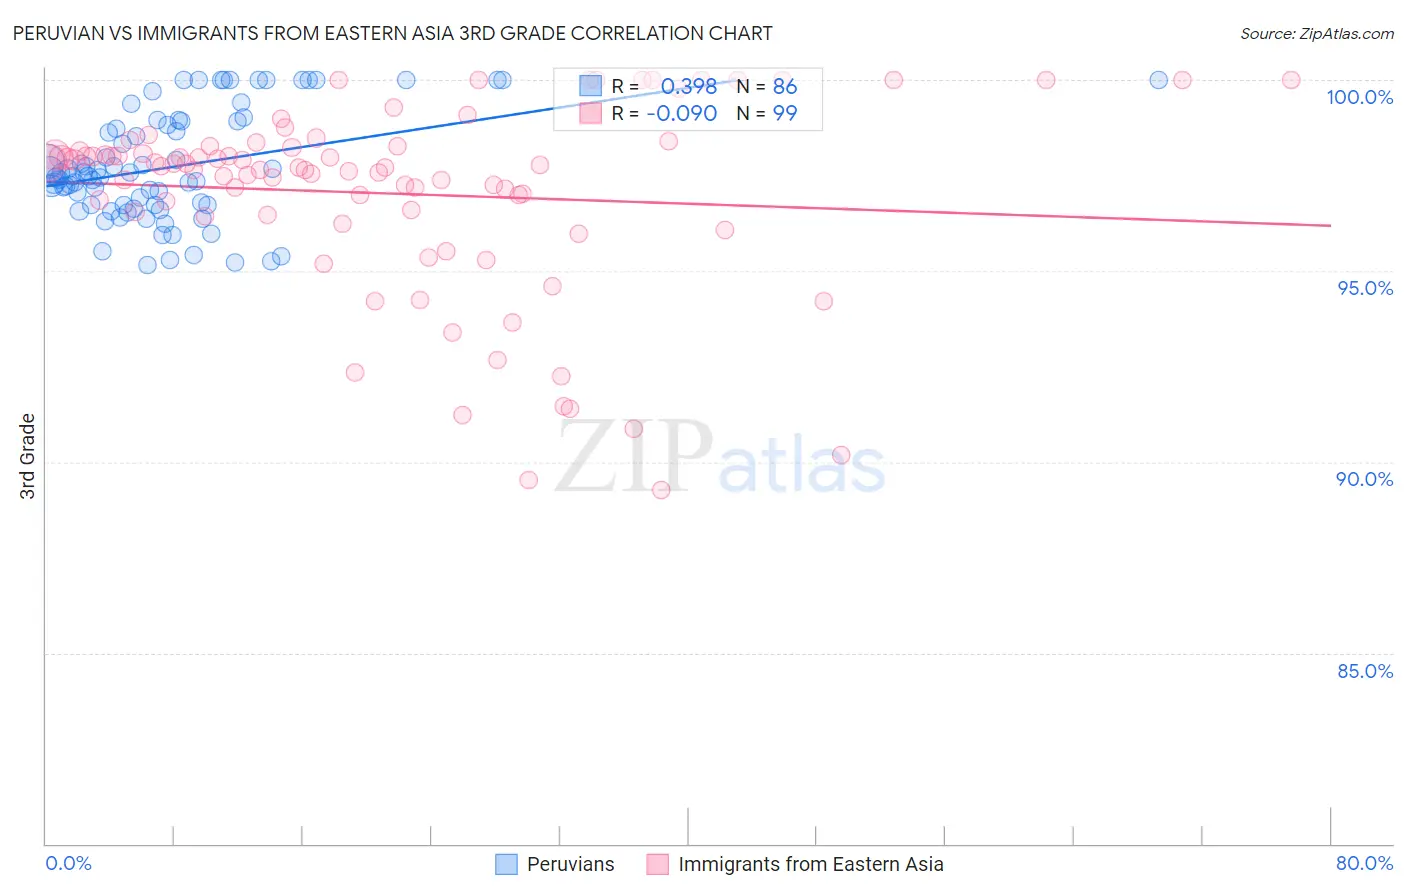
Peruvian vs Immigrants from Eastern Asia 3rd Grade Correlation Chart
The statistical analysis conducted on geographies consisting of 363,068,462 people shows a mild positive correlation between the proportion of Peruvians and percentage of population with at least 3rd grade education in the United States with a correlation coefficient (R) of 0.398 and weighted average of 97.4%. Similarly, the statistical analysis conducted on geographies consisting of 499,865,893 people shows a slight negative correlation between the proportion of Immigrants from Eastern Asia and percentage of population with at least 3rd grade education in the United States with a correlation coefficient (R) of -0.090 and weighted average of 97.4%, a difference of 0.080%.
3rd Grade Correlation Summary
| Measurement | Peruvian | Immigrants from Eastern Asia |
| Minimum | 95.2% | 89.3% |
| Maximum | 100.0% | 100.0% |
| Range | 4.8% | 10.7% |
| Mean | 97.7% | 97.0% |
| Median | 97.5% | 97.7% |
| Interquartile 25% (IQ1) | 96.7% | 96.5% |
| Interquartile 75% (IQ3) | 98.9% | 98.3% |
| Interquartile Range (IQR) | 2.2% | 1.8% |
| Standard Deviation (Sample) | 1.4% | 2.5% |
| Standard Deviation (Population) | 1.4% | 2.5% |
Demographics Similar to Peruvians and Immigrants from Eastern Asia by 3rd Grade
In terms of 3rd grade, the demographic groups most similar to Peruvians are Immigrants from Asia (97.4%, a difference of 0.0%), Immigrants from Africa (97.4%, a difference of 0.0%), Immigrants from Eastern Africa (97.4%, a difference of 0.010%), South American (97.4%, a difference of 0.010%), and Immigrants from Middle Africa (97.4%, a difference of 0.010%). Similarly, the demographic groups most similar to Immigrants from Eastern Asia are Immigrants from Iraq (97.4%, a difference of 0.010%), Liberian (97.4%, a difference of 0.010%), Colombian (97.4%, a difference of 0.010%), Immigrants from Uruguay (97.4%, a difference of 0.010%), and Immigrants from Malaysia (97.5%, a difference of 0.020%).
| Demographics | Rating | Rank | 3rd Grade |
| Immigrants | Malaysia | 2.4 /100 | #233 | Tragic 97.5% |
| Immigrants | Eastern Asia | 1.9 /100 | #234 | Tragic 97.4% |
| Immigrants | Iraq | 1.8 /100 | #235 | Tragic 97.4% |
| Liberians | 1.8 /100 | #236 | Tragic 97.4% |
| Colombians | 1.8 /100 | #237 | Tragic 97.4% |
| Immigrants | Uruguay | 1.7 /100 | #238 | Tragic 97.4% |
| Nigerians | 1.6 /100 | #239 | Tragic 97.4% |
| U.S. Virgin Islanders | 1.4 /100 | #240 | Tragic 97.4% |
| Immigrants | Indonesia | 1.4 /100 | #241 | Tragic 97.4% |
| Koreans | 1.3 /100 | #242 | Tragic 97.4% |
| Indians (Asian) | 1.3 /100 | #243 | Tragic 97.4% |
| Asians | 1.1 /100 | #244 | Tragic 97.4% |
| Ethiopians | 1.1 /100 | #245 | Tragic 97.4% |
| Immigrants | Senegal | 1.0 /100 | #246 | Tragic 97.4% |
| Assyrians/Chaldeans/Syriacs | 1.0 /100 | #247 | Tragic 97.4% |
| Immigrants | Eastern Africa | 0.9 /100 | #248 | Tragic 97.4% |
| South Americans | 0.9 /100 | #249 | Tragic 97.4% |
| Immigrants | Middle Africa | 0.9 /100 | #250 | Tragic 97.4% |
| Immigrants | Asia | 0.8 /100 | #251 | Tragic 97.4% |
| Peruvians | 0.8 /100 | #252 | Tragic 97.4% |
| Immigrants | Africa | 0.8 /100 | #253 | Tragic 97.4% |