Alsatian vs Immigrants from Eastern Asia 7th Grade
COMPARE
Alsatian
Immigrants from Eastern Asia
7th Grade
7th Grade Comparison
Alsatians
Immigrants from Eastern Asia
96.1%
7TH GRADE
67.2/ 100
METRIC RATING
159th/ 347
METRIC RANK
95.6%
7TH GRADE
5.8/ 100
METRIC RATING
226th/ 347
METRIC RANK
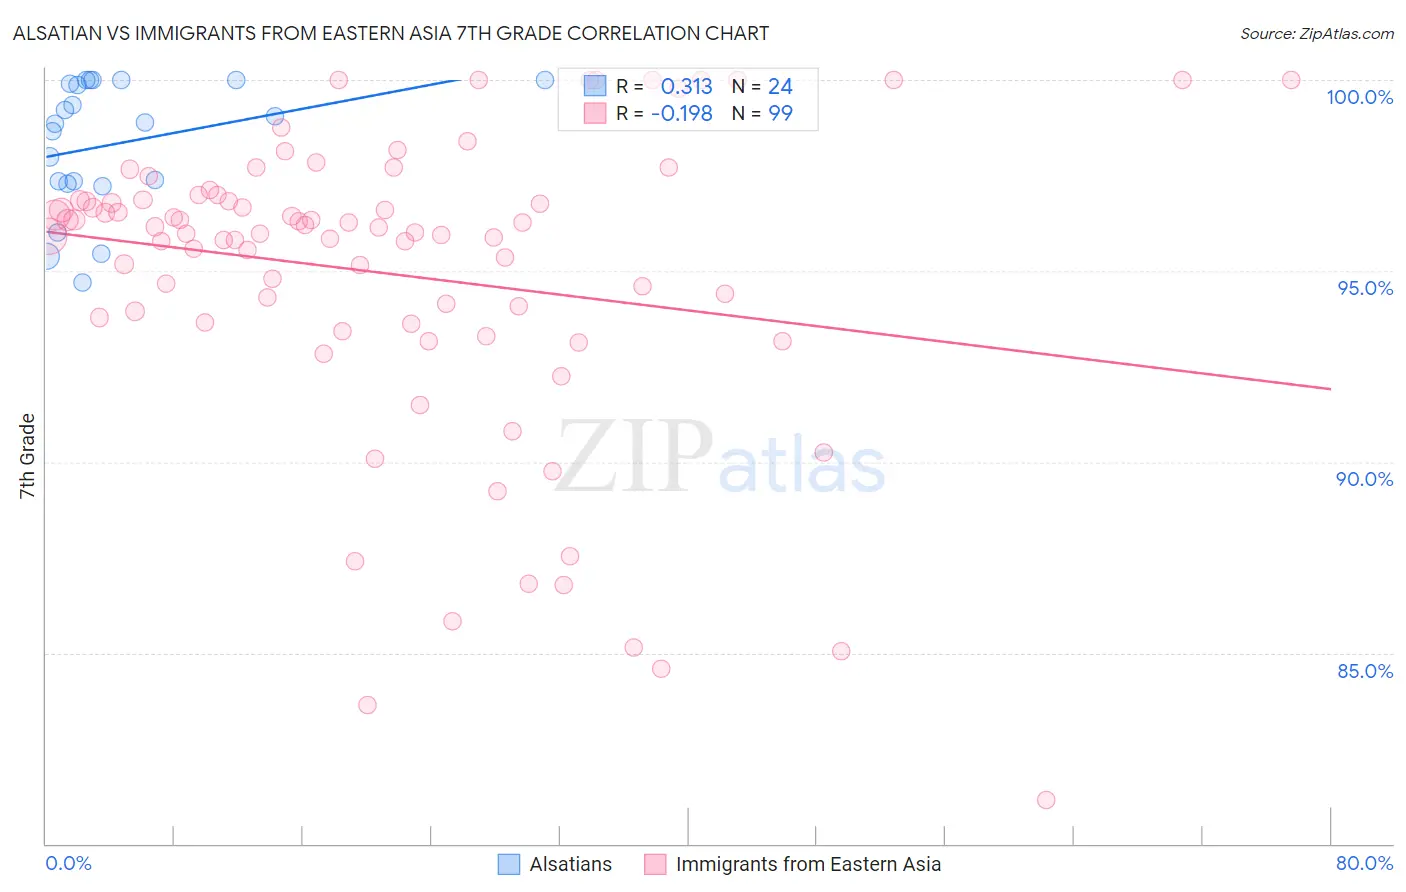
Alsatian vs Immigrants from Eastern Asia 7th Grade Correlation Chart
The statistical analysis conducted on geographies consisting of 82,676,581 people shows a mild positive correlation between the proportion of Alsatians and percentage of population with at least 7th grade education in the United States with a correlation coefficient (R) of 0.313 and weighted average of 96.1%. Similarly, the statistical analysis conducted on geographies consisting of 499,846,352 people shows a poor negative correlation between the proportion of Immigrants from Eastern Asia and percentage of population with at least 7th grade education in the United States with a correlation coefficient (R) of -0.198 and weighted average of 95.6%, a difference of 0.54%.
7th Grade Correlation Summary
| Measurement | Alsatian | Immigrants from Eastern Asia |
| Minimum | 94.7% | 81.1% |
| Maximum | 100.0% | 100.0% |
| Range | 5.3% | 18.9% |
| Mean | 98.3% | 94.9% |
| Median | 98.9% | 96.0% |
| Interquartile 25% (IQ1) | 97.3% | 93.7% |
| Interquartile 75% (IQ3) | 100.0% | 96.9% |
| Interquartile Range (IQR) | 2.6% | 3.2% |
| Standard Deviation (Sample) | 1.7% | 4.0% |
| Standard Deviation (Population) | 1.7% | 4.0% |
Similar Demographics by 7th Grade
Demographics Similar to Alsatians by 7th Grade
In terms of 7th grade, the demographic groups most similar to Alsatians are Immigrants from Kenya (96.1%, a difference of 0.0%), Arab (96.2%, a difference of 0.010%), Bermudan (96.1%, a difference of 0.010%), Pima (96.1%, a difference of 0.020%), and Spaniard (96.1%, a difference of 0.030%).
| Demographics | Rating | Rank | 7th Grade |
| Immigrants | Russia | 78.4 /100 | #152 | Good 96.2% |
| Seminole | 78.1 /100 | #153 | Good 96.2% |
| Immigrants | Israel | 77.6 /100 | #154 | Good 96.2% |
| Immigrants | Jordan | 77.0 /100 | #155 | Good 96.2% |
| Kenyans | 76.2 /100 | #156 | Good 96.2% |
| Ugandans | 75.5 /100 | #157 | Good 96.2% |
| Arabs | 68.6 /100 | #158 | Good 96.2% |
| Alsatians | 67.2 /100 | #159 | Good 96.1% |
| Immigrants | Kenya | 66.8 /100 | #160 | Good 96.1% |
| Bermudans | 66.3 /100 | #161 | Good 96.1% |
| Pima | 64.3 /100 | #162 | Good 96.1% |
| Spaniards | 62.6 /100 | #163 | Good 96.1% |
| Immigrants | Italy | 62.1 /100 | #164 | Good 96.1% |
| Immigrants | Taiwan | 61.5 /100 | #165 | Good 96.1% |
| Immigrants | Kazakhstan | 61.0 /100 | #166 | Good 96.1% |
Demographics Similar to Immigrants from Eastern Asia by 7th Grade
In terms of 7th grade, the demographic groups most similar to Immigrants from Eastern Asia are Immigrants from Malaysia (95.6%, a difference of 0.010%), Immigrants from Western Asia (95.6%, a difference of 0.010%), Immigrants from Syria (95.7%, a difference of 0.020%), Immigrants from Oceania (95.7%, a difference of 0.020%), and Immigrants from Eastern Africa (95.6%, a difference of 0.020%).
| Demographics | Rating | Rank | 7th Grade |
| Immigrants | Southern Europe | 7.9 /100 | #219 | Tragic 95.7% |
| Sub-Saharan Africans | 7.2 /100 | #220 | Tragic 95.7% |
| Samoans | 7.0 /100 | #221 | Tragic 95.7% |
| Laotians | 6.8 /100 | #222 | Tragic 95.7% |
| Immigrants | Syria | 6.7 /100 | #223 | Tragic 95.7% |
| Immigrants | Oceania | 6.7 /100 | #224 | Tragic 95.7% |
| Immigrants | Malaysia | 6.2 /100 | #225 | Tragic 95.6% |
| Immigrants | Eastern Asia | 5.8 /100 | #226 | Tragic 95.6% |
| Immigrants | Western Asia | 5.4 /100 | #227 | Tragic 95.6% |
| Immigrants | Eastern Africa | 5.1 /100 | #228 | Tragic 95.6% |
| Immigrants | Panama | 4.9 /100 | #229 | Tragic 95.6% |
| Natives/Alaskans | 4.2 /100 | #230 | Tragic 95.6% |
| Senegalese | 4.0 /100 | #231 | Tragic 95.6% |
| Costa Ricans | 3.3 /100 | #232 | Tragic 95.5% |
| Immigrants | Indonesia | 3.3 /100 | #233 | Tragic 95.5% |