Pima vs Immigrants from Denmark Associate's Degree
COMPARE
Pima
Immigrants from Denmark
Associate's Degree
Associate's Degree Comparison
Pima
Immigrants from Denmark
30.2%
ASSOCIATE'S DEGREE
0.0/ 100
METRIC RATING
345th/ 347
METRIC RANK
53.1%
ASSOCIATE'S DEGREE
100.0/ 100
METRIC RATING
37th/ 347
METRIC RANK
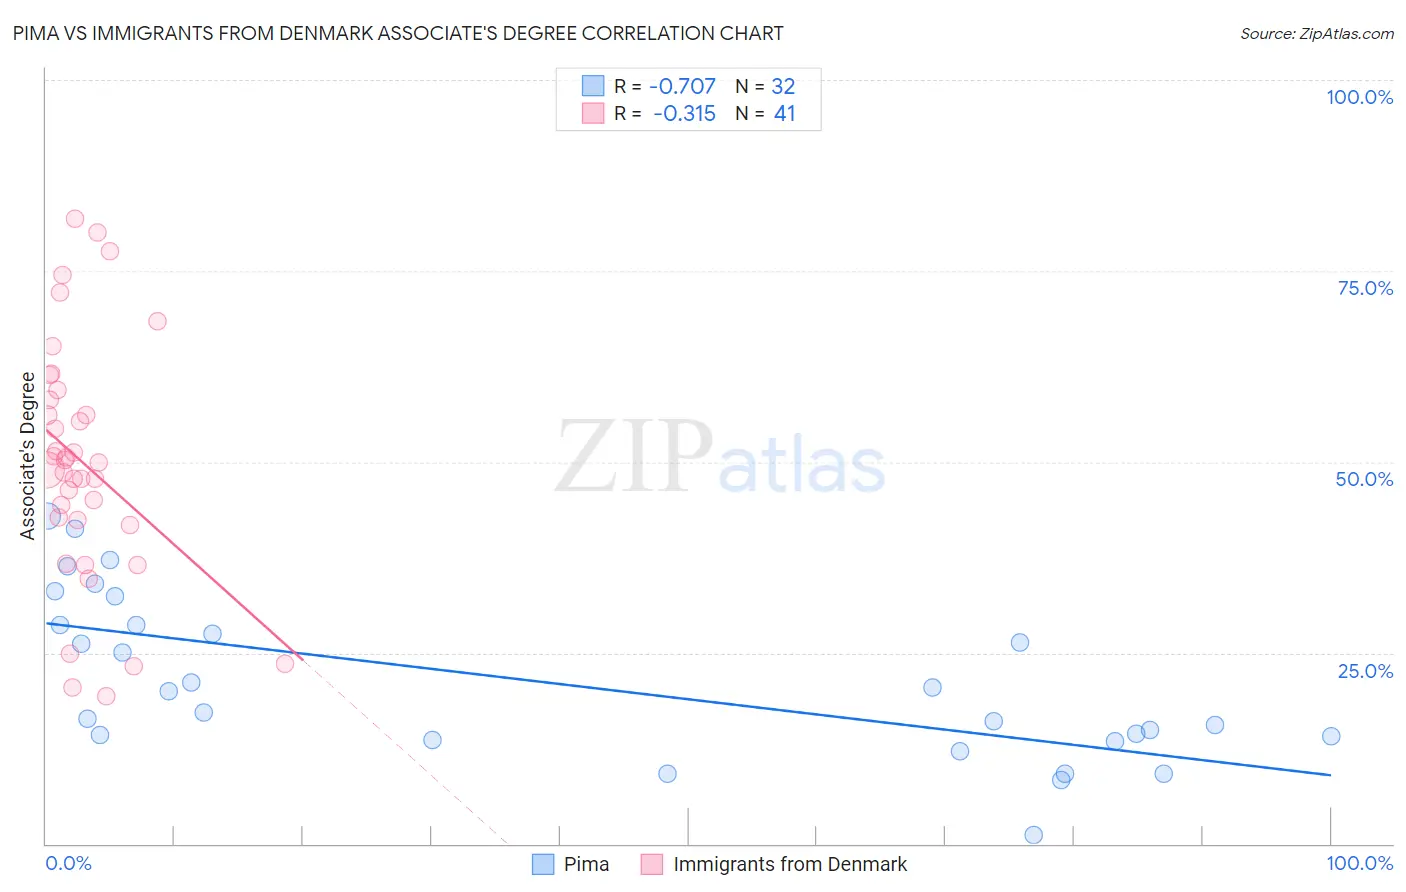
Pima vs Immigrants from Denmark Associate's Degree Correlation Chart
The statistical analysis conducted on geographies consisting of 61,552,411 people shows a strong negative correlation between the proportion of Pima and percentage of population with at least associate's degree education in the United States with a correlation coefficient (R) of -0.707 and weighted average of 30.2%. Similarly, the statistical analysis conducted on geographies consisting of 136,428,731 people shows a mild negative correlation between the proportion of Immigrants from Denmark and percentage of population with at least associate's degree education in the United States with a correlation coefficient (R) of -0.315 and weighted average of 53.1%, a difference of 75.5%.
Associate's Degree Correlation Summary
| Measurement | Pima | Immigrants from Denmark |
| Minimum | 1.2% | 19.3% |
| Maximum | 42.9% | 81.9% |
| Range | 41.8% | 62.5% |
| Mean | 21.3% | 49.9% |
| Median | 18.6% | 50.0% |
| Interquartile 25% (IQ1) | 13.8% | 42.1% |
| Interquartile 75% (IQ3) | 28.6% | 58.7% |
| Interquartile Range (IQR) | 14.8% | 16.6% |
| Standard Deviation (Sample) | 10.6% | 15.6% |
| Standard Deviation (Population) | 10.4% | 15.4% |
Similar Demographics by Associate's Degree
Demographics Similar to Pima by Associate's Degree
In terms of associate's degree, the demographic groups most similar to Pima are Yuman (31.3%, a difference of 3.4%), Tohono O'odham (31.8%, a difference of 5.1%), Yakama (32.3%, a difference of 6.9%), Houma (28.2%, a difference of 7.2%), and Inupiat (32.6%, a difference of 7.7%).
| Demographics | Rating | Rank | Associate's Degree |
| Mexicans | 0.0 /100 | #333 | Tragic 35.0% |
| Natives/Alaskans | 0.0 /100 | #334 | Tragic 34.9% |
| Spanish American Indians | 0.0 /100 | #335 | Tragic 34.9% |
| Hopi | 0.0 /100 | #336 | Tragic 34.6% |
| Lumbee | 0.0 /100 | #337 | Tragic 34.1% |
| Pueblo | 0.0 /100 | #338 | Tragic 34.0% |
| Immigrants | Mexico | 0.0 /100 | #339 | Tragic 33.7% |
| Navajo | 0.0 /100 | #340 | Tragic 32.6% |
| Inupiat | 0.0 /100 | #341 | Tragic 32.6% |
| Yakama | 0.0 /100 | #342 | Tragic 32.3% |
| Tohono O'odham | 0.0 /100 | #343 | Tragic 31.8% |
| Yuman | 0.0 /100 | #344 | Tragic 31.3% |
| Pima | 0.0 /100 | #345 | Tragic 30.2% |
| Houma | 0.0 /100 | #346 | Tragic 28.2% |
| Yup'ik | 0.0 /100 | #347 | Tragic 25.0% |
Demographics Similar to Immigrants from Denmark by Associate's Degree
In terms of associate's degree, the demographic groups most similar to Immigrants from Denmark are Immigrants from Russia (53.1%, a difference of 0.080%), Mongolian (53.0%, a difference of 0.16%), Russian (53.2%, a difference of 0.36%), Bulgarian (53.3%, a difference of 0.43%), and Immigrants from Belarus (52.8%, a difference of 0.45%).
| Demographics | Rating | Rank | Associate's Degree |
| Immigrants | Sri Lanka | 100.0 /100 | #30 | Exceptional 53.7% |
| Immigrants | Northern Europe | 100.0 /100 | #31 | Exceptional 53.5% |
| Immigrants | Turkey | 100.0 /100 | #32 | Exceptional 53.4% |
| Israelis | 100.0 /100 | #33 | Exceptional 53.4% |
| Bulgarians | 100.0 /100 | #34 | Exceptional 53.3% |
| Russians | 100.0 /100 | #35 | Exceptional 53.2% |
| Immigrants | Russia | 100.0 /100 | #36 | Exceptional 53.1% |
| Immigrants | Denmark | 100.0 /100 | #37 | Exceptional 53.1% |
| Mongolians | 100.0 /100 | #38 | Exceptional 53.0% |
| Immigrants | Belarus | 99.9 /100 | #39 | Exceptional 52.8% |
| Immigrants | Latvia | 99.9 /100 | #40 | Exceptional 52.8% |
| Immigrants | Saudi Arabia | 99.9 /100 | #41 | Exceptional 52.6% |
| Immigrants | Malaysia | 99.9 /100 | #42 | Exceptional 52.5% |
| Immigrants | South Africa | 99.9 /100 | #43 | Exceptional 52.5% |
| Estonians | 99.9 /100 | #44 | Exceptional 52.5% |