Peruvian vs Immigrants from Uzbekistan Bachelor's Degree
COMPARE
Peruvian
Immigrants from Uzbekistan
Bachelor's Degree
Bachelor's Degree Comparison
Peruvians
Immigrants from Uzbekistan
38.3%
BACHELOR'S DEGREE
63.4/ 100
METRIC RATING
163rd/ 347
METRIC RANK
42.8%
BACHELOR'S DEGREE
99.5/ 100
METRIC RATING
73rd/ 347
METRIC RANK
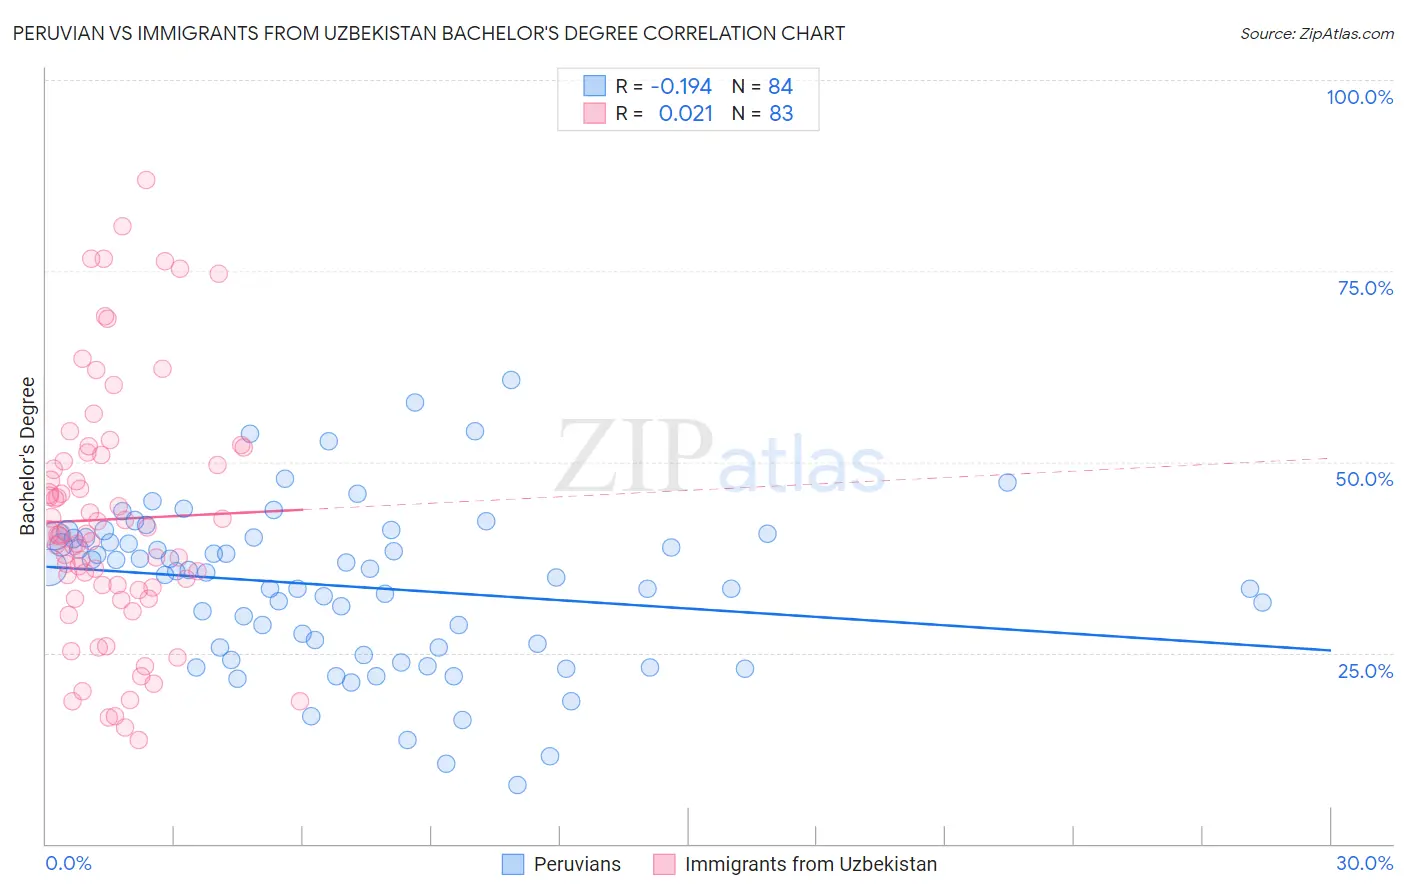
Peruvian vs Immigrants from Uzbekistan Bachelor's Degree Correlation Chart
The statistical analysis conducted on geographies consisting of 363,225,668 people shows a poor negative correlation between the proportion of Peruvians and percentage of population with at least bachelor's degree education in the United States with a correlation coefficient (R) of -0.194 and weighted average of 38.3%. Similarly, the statistical analysis conducted on geographies consisting of 118,752,495 people shows no correlation between the proportion of Immigrants from Uzbekistan and percentage of population with at least bachelor's degree education in the United States with a correlation coefficient (R) of 0.021 and weighted average of 42.8%, a difference of 11.6%.
Bachelor's Degree Correlation Summary
| Measurement | Peruvian | Immigrants from Uzbekistan |
| Minimum | 7.6% | 13.6% |
| Maximum | 60.7% | 86.9% |
| Range | 53.0% | 73.3% |
| Mean | 33.7% | 42.5% |
| Median | 35.6% | 40.5% |
| Interquartile 25% (IQ1) | 25.6% | 33.2% |
| Interquartile 75% (IQ3) | 40.1% | 50.9% |
| Interquartile Range (IQR) | 14.5% | 17.6% |
| Standard Deviation (Sample) | 10.5% | 16.4% |
| Standard Deviation (Population) | 10.5% | 16.3% |
Similar Demographics by Bachelor's Degree
Demographics Similar to Peruvians by Bachelor's Degree
In terms of bachelor's degree, the demographic groups most similar to Peruvians are Hungarian (38.3%, a difference of 0.14%), Colombian (38.4%, a difference of 0.17%), Uruguayan (38.4%, a difference of 0.25%), Vietnamese (38.5%, a difference of 0.33%), and Chinese (38.5%, a difference of 0.34%).
| Demographics | Rating | Rank | Bachelor's Degree |
| Kenyans | 72.5 /100 | #156 | Good 38.7% |
| Immigrants | South America | 70.1 /100 | #157 | Good 38.6% |
| Immigrants | Germany | 69.6 /100 | #158 | Good 38.6% |
| Chinese | 66.6 /100 | #159 | Good 38.5% |
| Vietnamese | 66.6 /100 | #160 | Good 38.5% |
| Uruguayans | 65.8 /100 | #161 | Good 38.4% |
| Colombians | 65.0 /100 | #162 | Good 38.4% |
| Peruvians | 63.4 /100 | #163 | Good 38.3% |
| Hungarians | 62.1 /100 | #164 | Good 38.3% |
| Sri Lankans | 59.1 /100 | #165 | Average 38.2% |
| Somalis | 58.6 /100 | #166 | Average 38.1% |
| Scottish | 56.6 /100 | #167 | Average 38.1% |
| Danes | 56.2 /100 | #168 | Average 38.1% |
| Ghanaians | 55.3 /100 | #169 | Average 38.0% |
| Czechs | 54.4 /100 | #170 | Average 38.0% |
Demographics Similar to Immigrants from Uzbekistan by Bachelor's Degree
In terms of bachelor's degree, the demographic groups most similar to Immigrants from Uzbekistan are Ethiopian (42.8%, a difference of 0.050%), Immigrants from Argentina (42.8%, a difference of 0.14%), Bhutanese (42.7%, a difference of 0.22%), Immigrants from Romania (42.9%, a difference of 0.40%), and Immigrants from Zimbabwe (42.6%, a difference of 0.44%).
| Demographics | Rating | Rank | Bachelor's Degree |
| Immigrants | Netherlands | 99.7 /100 | #66 | Exceptional 43.3% |
| Egyptians | 99.7 /100 | #67 | Exceptional 43.3% |
| Immigrants | Indonesia | 99.7 /100 | #68 | Exceptional 43.3% |
| Immigrants | Pakistan | 99.7 /100 | #69 | Exceptional 43.1% |
| Immigrants | Romania | 99.6 /100 | #70 | Exceptional 42.9% |
| Immigrants | Argentina | 99.6 /100 | #71 | Exceptional 42.8% |
| Ethiopians | 99.5 /100 | #72 | Exceptional 42.8% |
| Immigrants | Uzbekistan | 99.5 /100 | #73 | Exceptional 42.8% |
| Bhutanese | 99.5 /100 | #74 | Exceptional 42.7% |
| Immigrants | Zimbabwe | 99.4 /100 | #75 | Exceptional 42.6% |
| Immigrants | Egypt | 99.4 /100 | #76 | Exceptional 42.6% |
| Immigrants | Eastern Europe | 99.4 /100 | #77 | Exceptional 42.5% |
| Immigrants | Ethiopia | 99.4 /100 | #78 | Exceptional 42.5% |
| Immigrants | Lebanon | 99.3 /100 | #79 | Exceptional 42.4% |
| Immigrants | Croatia | 99.2 /100 | #80 | Exceptional 42.3% |