Pennsylvania German vs Immigrants from Eritrea 11th Grade
COMPARE
Pennsylvania German
Immigrants from Eritrea
11th Grade
11th Grade Comparison
Pennsylvania Germans
Immigrants from Eritrea
90.3%
11TH GRADE
0.0/ 100
METRIC RATING
288th/ 347
METRIC RANK
91.4%
11TH GRADE
0.7/ 100
METRIC RATING
254th/ 347
METRIC RANK
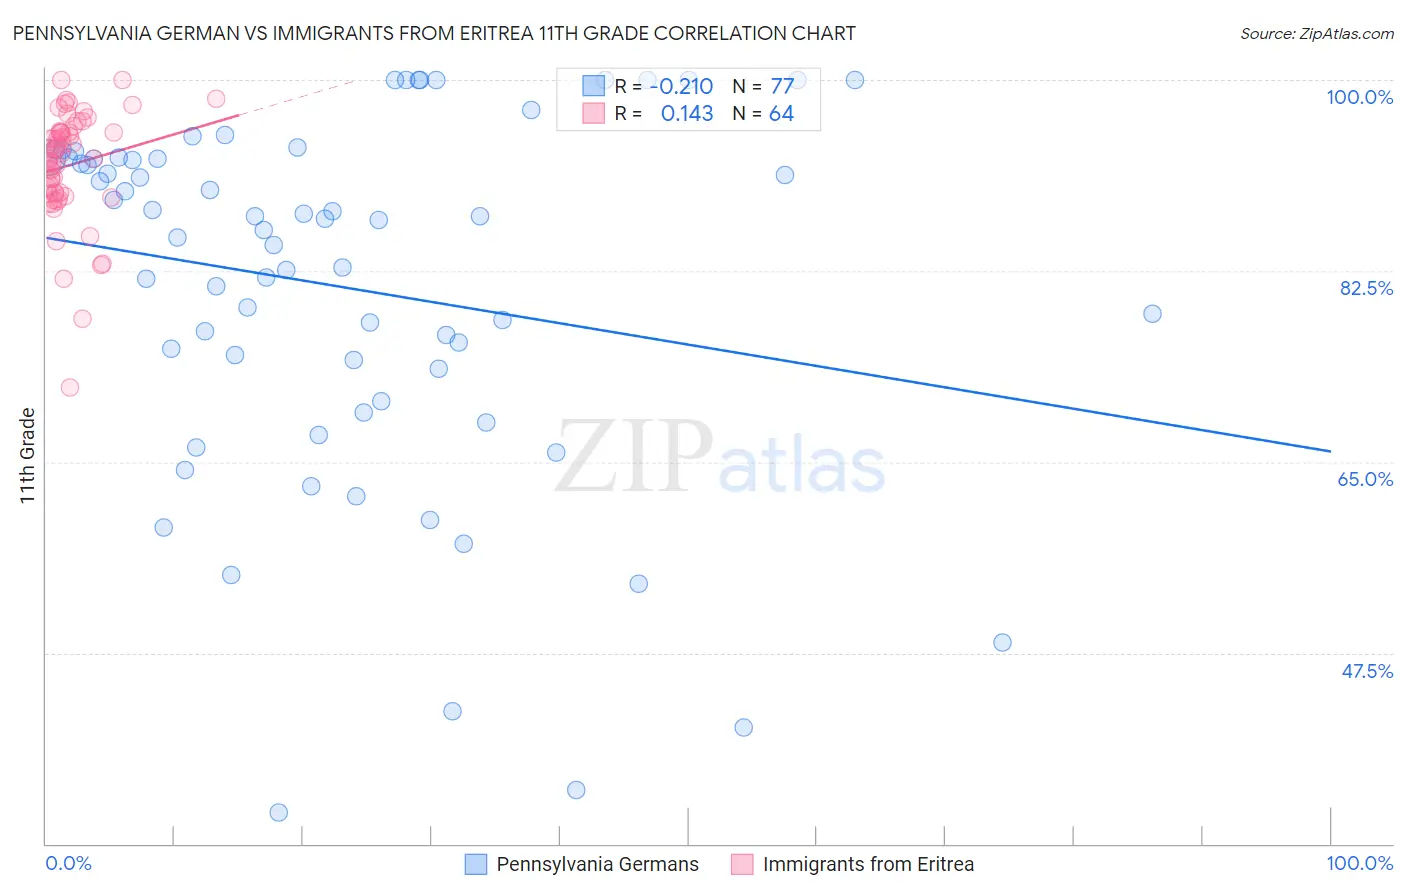
Pennsylvania German vs Immigrants from Eritrea 11th Grade Correlation Chart
The statistical analysis conducted on geographies consisting of 234,103,013 people shows a weak negative correlation between the proportion of Pennsylvania Germans and percentage of population with at least 11th grade education in the United States with a correlation coefficient (R) of -0.210 and weighted average of 90.3%. Similarly, the statistical analysis conducted on geographies consisting of 104,754,230 people shows a poor positive correlation between the proportion of Immigrants from Eritrea and percentage of population with at least 11th grade education in the United States with a correlation coefficient (R) of 0.143 and weighted average of 91.4%, a difference of 1.2%.
11th Grade Correlation Summary
| Measurement | Pennsylvania German | Immigrants from Eritrea |
| Minimum | 32.9% | 71.8% |
| Maximum | 100.0% | 100.0% |
| Range | 67.1% | 28.2% |
| Mean | 81.0% | 92.2% |
| Median | 87.1% | 93.1% |
| Interquartile 25% (IQ1) | 72.1% | 89.6% |
| Interquartile 75% (IQ3) | 92.9% | 95.2% |
| Interquartile Range (IQR) | 20.8% | 5.7% |
| Standard Deviation (Sample) | 16.6% | 5.1% |
| Standard Deviation (Population) | 16.4% | 5.1% |
Similar Demographics by 11th Grade
Demographics Similar to Pennsylvania Germans by 11th Grade
In terms of 11th grade, the demographic groups most similar to Pennsylvania Germans are Apache (90.4%, a difference of 0.020%), British West Indian (90.3%, a difference of 0.020%), Immigrants from West Indies (90.4%, a difference of 0.030%), Indonesian (90.3%, a difference of 0.050%), and Immigrants from Burma/Myanmar (90.4%, a difference of 0.080%).
| Demographics | Rating | Rank | 11th Grade |
| Dutch West Indians | 0.0 /100 | #281 | Tragic 90.7% |
| Immigrants | St. Vincent and the Grenadines | 0.0 /100 | #282 | Tragic 90.7% |
| Immigrants | Barbados | 0.0 /100 | #283 | Tragic 90.7% |
| Immigrants | Laos | 0.0 /100 | #284 | Tragic 90.5% |
| Immigrants | Burma/Myanmar | 0.0 /100 | #285 | Tragic 90.4% |
| Immigrants | West Indies | 0.0 /100 | #286 | Tragic 90.4% |
| Apache | 0.0 /100 | #287 | Tragic 90.4% |
| Pennsylvania Germans | 0.0 /100 | #288 | Tragic 90.3% |
| British West Indians | 0.0 /100 | #289 | Tragic 90.3% |
| Indonesians | 0.0 /100 | #290 | Tragic 90.3% |
| Haitians | 0.0 /100 | #291 | Tragic 90.3% |
| Cubans | 0.0 /100 | #292 | Tragic 90.2% |
| Natives/Alaskans | 0.0 /100 | #293 | Tragic 90.2% |
| Immigrants | Grenada | 0.0 /100 | #294 | Tragic 90.1% |
| Immigrants | Vietnam | 0.0 /100 | #295 | Tragic 90.0% |
Demographics Similar to Immigrants from Eritrea by 11th Grade
In terms of 11th grade, the demographic groups most similar to Immigrants from Eritrea are Black/African American (91.4%, a difference of 0.010%), Immigrants from Senegal (91.4%, a difference of 0.010%), Immigrants from Nigeria (91.4%, a difference of 0.020%), Immigrants from South America (91.4%, a difference of 0.020%), and Cajun (91.4%, a difference of 0.020%).
| Demographics | Rating | Rank | 11th Grade |
| Immigrants | Philippines | 1.0 /100 | #247 | Tragic 91.5% |
| Immigrants | Uzbekistan | 1.0 /100 | #248 | Tragic 91.5% |
| Peruvians | 1.0 /100 | #249 | Tragic 91.5% |
| Ghanaians | 0.9 /100 | #250 | Tragic 91.5% |
| Immigrants | Costa Rica | 0.9 /100 | #251 | Tragic 91.4% |
| Immigrants | Nigeria | 0.8 /100 | #252 | Tragic 91.4% |
| Immigrants | South America | 0.8 /100 | #253 | Tragic 91.4% |
| Immigrants | Eritrea | 0.7 /100 | #254 | Tragic 91.4% |
| Blacks/African Americans | 0.7 /100 | #255 | Tragic 91.4% |
| Immigrants | Senegal | 0.7 /100 | #256 | Tragic 91.4% |
| Cajuns | 0.7 /100 | #257 | Tragic 91.4% |
| Immigrants | Colombia | 0.6 /100 | #258 | Tragic 91.4% |
| Jamaicans | 0.6 /100 | #259 | Tragic 91.4% |
| Spanish Americans | 0.6 /100 | #260 | Tragic 91.4% |
| Taiwanese | 0.6 /100 | #261 | Tragic 91.3% |