Paraguayan vs Tohono O'odham Unemployment Among Ages 65 to 74 years
COMPARE
Paraguayan
Tohono O'odham
Unemployment Among Ages 65 to 74 years
Unemployment Among Ages 65 to 74 years Comparison
Paraguayans
Tohono O'odham
5.6%
UNEMPLOYMENT AMONG AGES 65 TO 74 YEARS
0.9/ 100
METRIC RATING
246th/ 347
METRIC RANK
6.0%
UNEMPLOYMENT AMONG AGES 65 TO 74 YEARS
0.0/ 100
METRIC RATING
324th/ 347
METRIC RANK
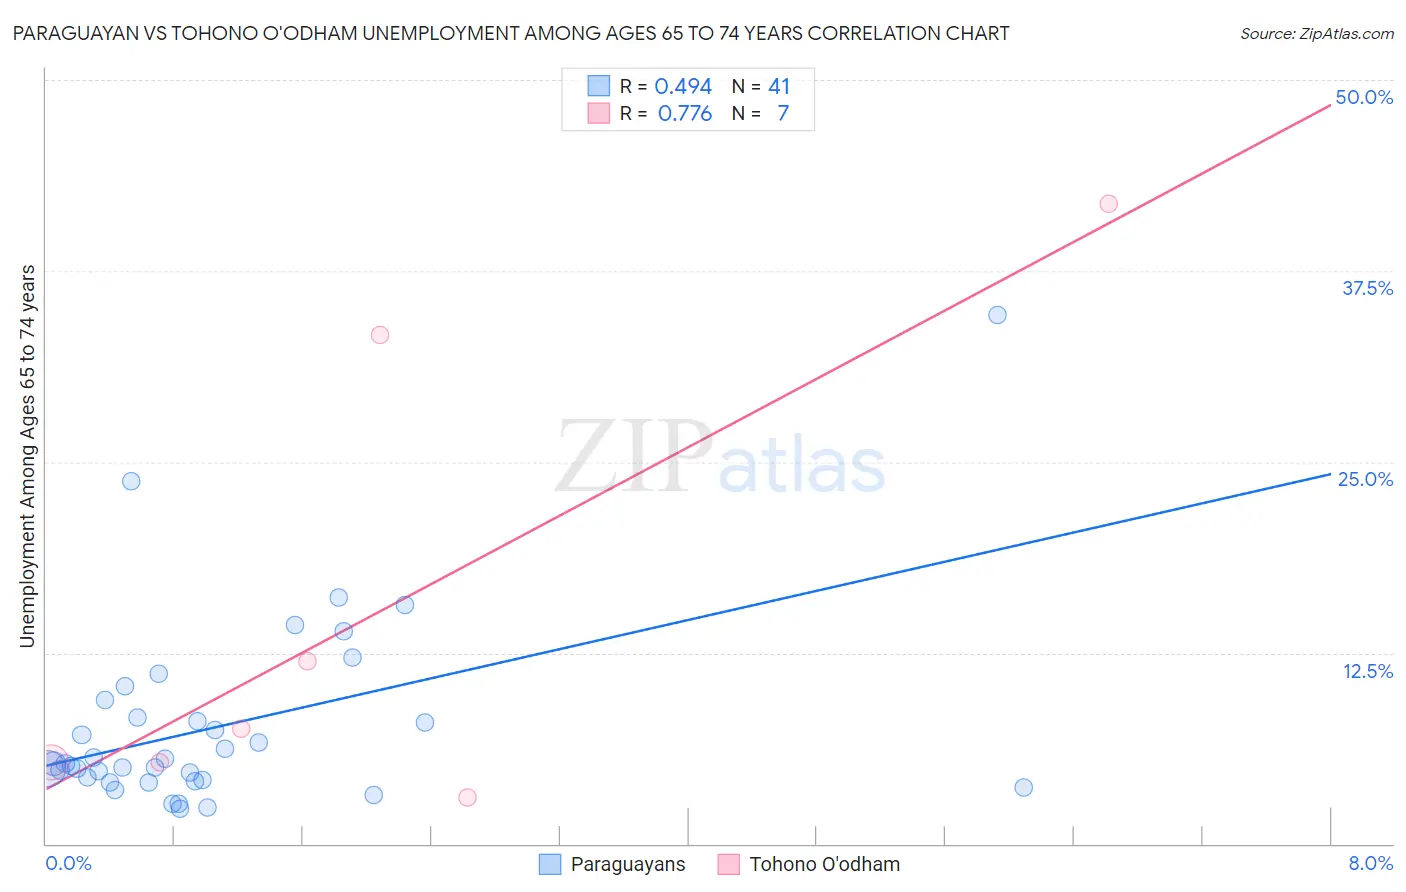
Paraguayan vs Tohono O'odham Unemployment Among Ages 65 to 74 years Correlation Chart
The statistical analysis conducted on geographies consisting of 91,862,243 people shows a moderate positive correlation between the proportion of Paraguayans and unemployment rate among population between the ages 65 and 74 in the United States with a correlation coefficient (R) of 0.494 and weighted average of 5.6%. Similarly, the statistical analysis conducted on geographies consisting of 57,258,551 people shows a strong positive correlation between the proportion of Tohono O'odham and unemployment rate among population between the ages 65 and 74 in the United States with a correlation coefficient (R) of 0.776 and weighted average of 6.0%, a difference of 8.0%.
Unemployment Among Ages 65 to 74 years Correlation Summary
| Measurement | Paraguayan | Tohono O'odham |
| Minimum | 2.3% | 3.0% |
| Maximum | 34.6% | 41.9% |
| Range | 32.3% | 38.9% |
| Mean | 7.7% | 15.5% |
| Median | 5.2% | 7.6% |
| Interquartile 25% (IQ1) | 4.2% | 5.3% |
| Interquartile 75% (IQ3) | 8.9% | 33.3% |
| Interquartile Range (IQR) | 4.7% | 28.0% |
| Standard Deviation (Sample) | 6.2% | 15.6% |
| Standard Deviation (Population) | 6.2% | 14.4% |
Similar Demographics by Unemployment Among Ages 65 to 74 years
Demographics Similar to Paraguayans by Unemployment Among Ages 65 to 74 years
In terms of unemployment among ages 65 to 74 years, the demographic groups most similar to Paraguayans are Immigrants from Micronesia (5.6%, a difference of 0.010%), Immigrants from Greece (5.6%, a difference of 0.010%), Immigrants (5.6%, a difference of 0.050%), Immigrants from Argentina (5.6%, a difference of 0.050%), and Trinidadian and Tobagonian (5.6%, a difference of 0.12%).
| Demographics | Rating | Rank | Unemployment Among Ages 65 to 74 years |
| German Russians | 1.6 /100 | #239 | Tragic 5.5% |
| Ghanaians | 1.4 /100 | #240 | Tragic 5.6% |
| Cree | 1.4 /100 | #241 | Tragic 5.6% |
| Immigrants | Ghana | 1.4 /100 | #242 | Tragic 5.6% |
| Immigrants | Peru | 1.3 /100 | #243 | Tragic 5.6% |
| Immigrants | Micronesia | 0.9 /100 | #244 | Tragic 5.6% |
| Immigrants | Greece | 0.9 /100 | #245 | Tragic 5.6% |
| Paraguayans | 0.9 /100 | #246 | Tragic 5.6% |
| Immigrants | Immigrants | 0.9 /100 | #247 | Tragic 5.6% |
| Immigrants | Argentina | 0.9 /100 | #248 | Tragic 5.6% |
| Trinidadians and Tobagonians | 0.8 /100 | #249 | Tragic 5.6% |
| Cape Verdeans | 0.7 /100 | #250 | Tragic 5.6% |
| Brazilians | 0.5 /100 | #251 | Tragic 5.6% |
| Colombians | 0.5 /100 | #252 | Tragic 5.6% |
| Immigrants | Brazil | 0.5 /100 | #253 | Tragic 5.6% |
Demographics Similar to Tohono O'odham by Unemployment Among Ages 65 to 74 years
In terms of unemployment among ages 65 to 74 years, the demographic groups most similar to Tohono O'odham are Immigrants from Portugal (6.0%, a difference of 0.12%), Native/Alaskan (6.0%, a difference of 0.36%), Delaware (6.0%, a difference of 0.58%), Immigrants from Mexico (6.0%, a difference of 0.63%), and Immigrants from Dominica (6.0%, a difference of 0.85%).
| Demographics | Rating | Rank | Unemployment Among Ages 65 to 74 years |
| Immigrants | Central America | 0.0 /100 | #317 | Tragic 5.9% |
| Zimbabweans | 0.0 /100 | #318 | Tragic 5.9% |
| Aleuts | 0.0 /100 | #319 | Tragic 5.9% |
| Immigrants | Bahamas | 0.0 /100 | #320 | Tragic 5.9% |
| Immigrants | Dominica | 0.0 /100 | #321 | Tragic 6.0% |
| Immigrants | Mexico | 0.0 /100 | #322 | Tragic 6.0% |
| Delaware | 0.0 /100 | #323 | Tragic 6.0% |
| Tohono O'odham | 0.0 /100 | #324 | Tragic 6.0% |
| Immigrants | Portugal | 0.0 /100 | #325 | Tragic 6.0% |
| Natives/Alaskans | 0.0 /100 | #326 | Tragic 6.0% |
| Shoshone | 0.0 /100 | #327 | Tragic 6.2% |
| Immigrants | Azores | 0.0 /100 | #328 | Tragic 6.2% |
| Yuman | 0.0 /100 | #329 | Tragic 6.2% |
| Dominicans | 0.0 /100 | #330 | Tragic 6.3% |
| Bermudans | 0.0 /100 | #331 | Tragic 6.3% |