Paraguayan vs Yakama 9th Grade
COMPARE
Paraguayan
Yakama
9th Grade
9th Grade Comparison
Paraguayans
Yakama
94.7%
9TH GRADE
30.1/ 100
METRIC RATING
193rd/ 347
METRIC RANK
90.1%
9TH GRADE
0.0/ 100
METRIC RATING
339th/ 347
METRIC RANK
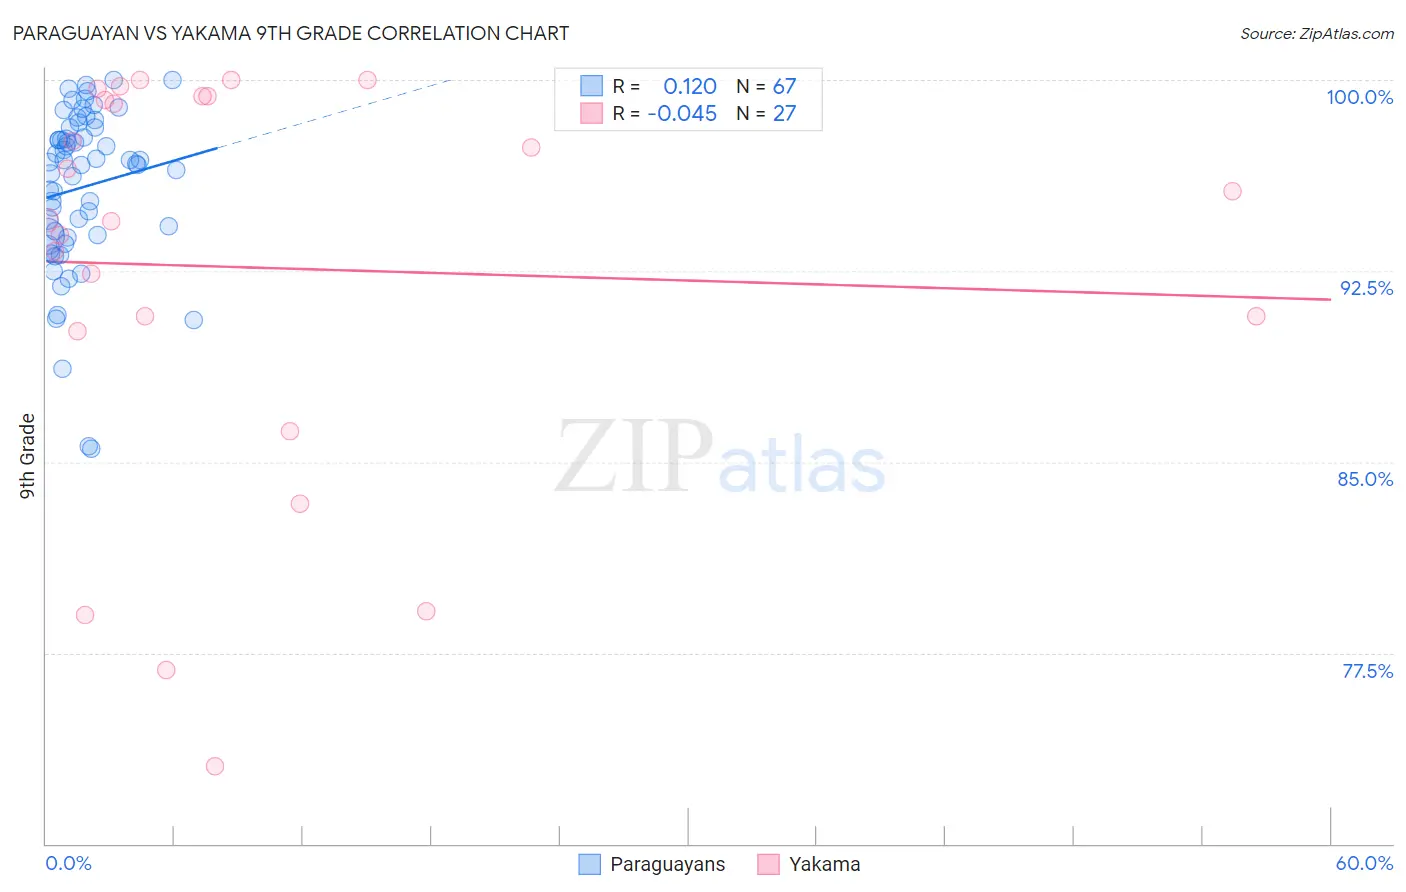
Paraguayan vs Yakama 9th Grade Correlation Chart
The statistical analysis conducted on geographies consisting of 95,114,701 people shows a poor positive correlation between the proportion of Paraguayans and percentage of population with at least 9th grade education in the United States with a correlation coefficient (R) of 0.120 and weighted average of 94.7%. Similarly, the statistical analysis conducted on geographies consisting of 19,923,144 people shows no correlation between the proportion of Yakama and percentage of population with at least 9th grade education in the United States with a correlation coefficient (R) of -0.045 and weighted average of 90.1%, a difference of 5.2%.
9th Grade Correlation Summary
| Measurement | Paraguayan | Yakama |
| Minimum | 85.5% | 73.0% |
| Maximum | 100.0% | 100.0% |
| Range | 14.5% | 27.0% |
| Mean | 95.8% | 92.6% |
| Median | 96.7% | 94.5% |
| Interquartile 25% (IQ1) | 93.8% | 90.1% |
| Interquartile 75% (IQ3) | 98.1% | 99.3% |
| Interquartile Range (IQR) | 4.3% | 9.2% |
| Standard Deviation (Sample) | 3.2% | 8.0% |
| Standard Deviation (Population) | 3.2% | 7.8% |
Similar Demographics by 9th Grade
Demographics Similar to Paraguayans by 9th Grade
In terms of 9th grade, the demographic groups most similar to Paraguayans are Immigrants from Northern Africa (94.7%, a difference of 0.010%), Panamanian (94.7%, a difference of 0.010%), Sudanese (94.7%, a difference of 0.020%), Assyrian/Chaldean/Syriac (94.7%, a difference of 0.020%), and Marshallese (94.7%, a difference of 0.020%).
| Demographics | Rating | Rank | 9th Grade |
| Hopi | 37.1 /100 | #186 | Fair 94.8% |
| Guamanians/Chamorros | 35.5 /100 | #187 | Fair 94.8% |
| Immigrants | Albania | 34.5 /100 | #188 | Fair 94.8% |
| Immigrants | Argentina | 34.4 /100 | #189 | Fair 94.8% |
| Sudanese | 32.7 /100 | #190 | Fair 94.7% |
| Assyrians/Chaldeans/Syriacs | 32.0 /100 | #191 | Fair 94.7% |
| Immigrants | Northern Africa | 30.7 /100 | #192 | Fair 94.7% |
| Paraguayans | 30.1 /100 | #193 | Fair 94.7% |
| Panamanians | 29.0 /100 | #194 | Fair 94.7% |
| Marshallese | 27.9 /100 | #195 | Fair 94.7% |
| Immigrants | Lebanon | 27.2 /100 | #196 | Fair 94.7% |
| Immigrants | Micronesia | 24.7 /100 | #197 | Fair 94.7% |
| Hawaiians | 22.7 /100 | #198 | Fair 94.7% |
| Laotians | 21.0 /100 | #199 | Fair 94.6% |
| Immigrants | Zaire | 20.6 /100 | #200 | Fair 94.6% |
Demographics Similar to Yakama by 9th Grade
In terms of 9th grade, the demographic groups most similar to Yakama are Mexican (90.0%, a difference of 0.060%), Guatemalan (89.9%, a difference of 0.19%), Central American (90.4%, a difference of 0.34%), Immigrants from Latin America (90.4%, a difference of 0.35%), and Immigrants from Dominican Republic (90.5%, a difference of 0.47%).
| Demographics | Rating | Rank | 9th Grade |
| Hispanics or Latinos | 0.0 /100 | #332 | Tragic 90.9% |
| Immigrants | Yemen | 0.0 /100 | #333 | Tragic 90.8% |
| Immigrants | Azores | 0.0 /100 | #334 | Tragic 90.8% |
| Immigrants | Honduras | 0.0 /100 | #335 | Tragic 90.6% |
| Immigrants | Dominican Republic | 0.0 /100 | #336 | Tragic 90.5% |
| Immigrants | Latin America | 0.0 /100 | #337 | Tragic 90.4% |
| Central Americans | 0.0 /100 | #338 | Tragic 90.4% |
| Yakama | 0.0 /100 | #339 | Tragic 90.1% |
| Mexicans | 0.0 /100 | #340 | Tragic 90.0% |
| Guatemalans | 0.0 /100 | #341 | Tragic 89.9% |
| Salvadorans | 0.0 /100 | #342 | Tragic 89.6% |
| Immigrants | Guatemala | 0.0 /100 | #343 | Tragic 89.4% |
| Immigrants | El Salvador | 0.0 /100 | #344 | Tragic 89.0% |
| Immigrants | Central America | 0.0 /100 | #345 | Tragic 89.0% |
| Immigrants | Mexico | 0.0 /100 | #346 | Tragic 88.7% |