Paraguayan vs Immigrants from Ethiopia 10th Grade
COMPARE
Paraguayan
Immigrants from Ethiopia
10th Grade
10th Grade Comparison
Paraguayans
Immigrants from Ethiopia
93.7%
10TH GRADE
45.3/ 100
METRIC RATING
179th/ 347
METRIC RANK
93.1%
10TH GRADE
5.1/ 100
METRIC RATING
229th/ 347
METRIC RANK
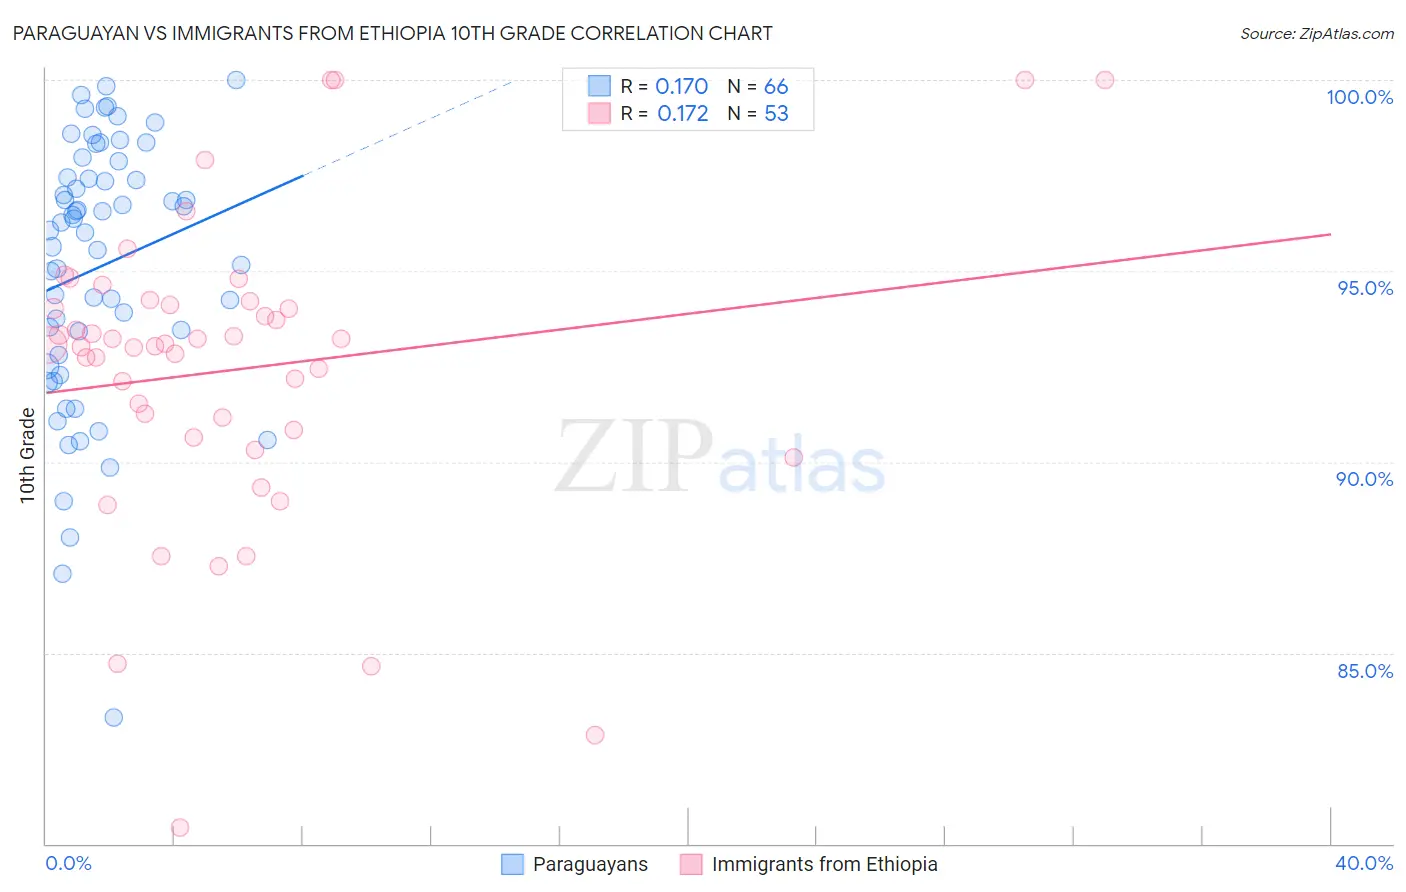
Paraguayan vs Immigrants from Ethiopia 10th Grade Correlation Chart
The statistical analysis conducted on geographies consisting of 95,114,201 people shows a poor positive correlation between the proportion of Paraguayans and percentage of population with at least 10th grade education in the United States with a correlation coefficient (R) of 0.170 and weighted average of 93.7%. Similarly, the statistical analysis conducted on geographies consisting of 211,528,629 people shows a poor positive correlation between the proportion of Immigrants from Ethiopia and percentage of population with at least 10th grade education in the United States with a correlation coefficient (R) of 0.172 and weighted average of 93.1%, a difference of 0.62%.
10th Grade Correlation Summary
| Measurement | Paraguayan | Immigrants from Ethiopia |
| Minimum | 83.3% | 80.4% |
| Maximum | 100.0% | 100.0% |
| Range | 16.7% | 19.6% |
| Mean | 95.1% | 92.4% |
| Median | 96.2% | 93.1% |
| Interquartile 25% (IQ1) | 92.8% | 90.7% |
| Interquartile 75% (IQ3) | 97.4% | 94.2% |
| Interquartile Range (IQR) | 4.7% | 3.4% |
| Standard Deviation (Sample) | 3.5% | 4.0% |
| Standard Deviation (Population) | 3.4% | 3.9% |
Similar Demographics by 10th Grade
Demographics Similar to Paraguayans by 10th Grade
In terms of 10th grade, the demographic groups most similar to Paraguayans are Sierra Leonean (93.7%, a difference of 0.010%), Immigrants from Argentina (93.7%, a difference of 0.020%), Immigrants from Lebanon (93.7%, a difference of 0.020%), Blackfeet (93.7%, a difference of 0.020%), and Immigrants from Northern Africa (93.7%, a difference of 0.030%).
| Demographics | Rating | Rank | 10th Grade |
| French American Indians | 50.9 /100 | #172 | Average 93.7% |
| Spaniards | 50.3 /100 | #173 | Average 93.7% |
| Argentineans | 50.0 /100 | #174 | Average 93.7% |
| Immigrants | Nepal | 49.6 /100 | #175 | Average 93.7% |
| Immigrants | Argentina | 47.1 /100 | #176 | Average 93.7% |
| Immigrants | Lebanon | 47.1 /100 | #177 | Average 93.7% |
| Sierra Leoneans | 46.1 /100 | #178 | Average 93.7% |
| Paraguayans | 45.3 /100 | #179 | Average 93.7% |
| Blackfeet | 42.8 /100 | #180 | Average 93.7% |
| Immigrants | Northern Africa | 41.6 /100 | #181 | Average 93.7% |
| Colville | 38.8 /100 | #182 | Fair 93.6% |
| Guamanians/Chamorros | 37.1 /100 | #183 | Fair 93.6% |
| Choctaw | 36.6 /100 | #184 | Fair 93.6% |
| Sudanese | 36.6 /100 | #185 | Fair 93.6% |
| Immigrants | Eastern Asia | 35.1 /100 | #186 | Fair 93.6% |
Demographics Similar to Immigrants from Ethiopia by 10th Grade
In terms of 10th grade, the demographic groups most similar to Immigrants from Ethiopia are Immigrants from Africa (93.1%, a difference of 0.0%), South American Indian (93.1%, a difference of 0.010%), Bahamian (93.1%, a difference of 0.010%), Comanche (93.1%, a difference of 0.010%), and Subsaharan African (93.1%, a difference of 0.020%).
| Demographics | Rating | Rank | 10th Grade |
| Ethiopians | 7.9 /100 | #222 | Tragic 93.2% |
| Immigrants | Sierra Leone | 7.6 /100 | #223 | Tragic 93.2% |
| Bolivians | 6.7 /100 | #224 | Tragic 93.2% |
| Somalis | 6.2 /100 | #225 | Tragic 93.2% |
| Koreans | 6.1 /100 | #226 | Tragic 93.2% |
| Blacks/African Americans | 6.0 /100 | #227 | Tragic 93.2% |
| Immigrants | China | 5.9 /100 | #228 | Tragic 93.2% |
| Immigrants | Ethiopia | 5.1 /100 | #229 | Tragic 93.1% |
| Immigrants | Africa | 5.0 /100 | #230 | Tragic 93.1% |
| South American Indians | 4.9 /100 | #231 | Tragic 93.1% |
| Bahamians | 4.9 /100 | #232 | Tragic 93.1% |
| Comanche | 4.9 /100 | #233 | Tragic 93.1% |
| Sub-Saharan Africans | 4.7 /100 | #234 | Tragic 93.1% |
| Africans | 4.6 /100 | #235 | Tragic 93.1% |
| Afghans | 4.5 /100 | #236 | Tragic 93.1% |