Paraguayan vs Immigrants from Uruguay Unemployment Among Ages 30 to 34 years
COMPARE
Paraguayan
Immigrants from Uruguay
Unemployment Among Ages 30 to 34 years
Unemployment Among Ages 30 to 34 years Comparison
Paraguayans
Immigrants from Uruguay
5.1%
UNEMPLOYMENT AMONG AGES 30 TO 34 YEARS
96.4/ 100
METRIC RATING
71st/ 347
METRIC RANK
5.3%
UNEMPLOYMENT AMONG AGES 30 TO 34 YEARS
79.3/ 100
METRIC RATING
128th/ 347
METRIC RANK
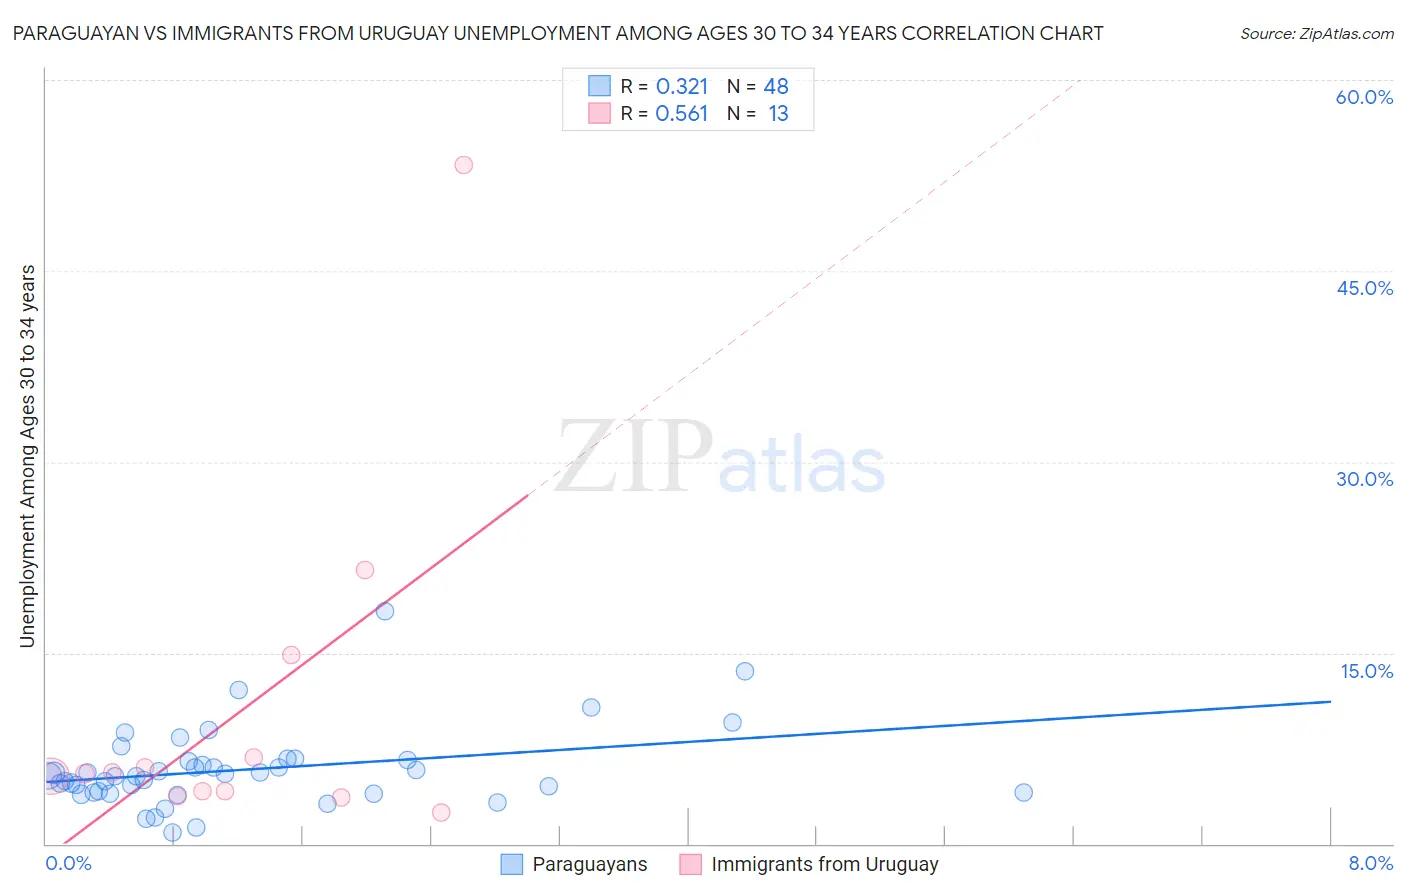
Paraguayan vs Immigrants from Uruguay Unemployment Among Ages 30 to 34 years Correlation Chart
The statistical analysis conducted on geographies consisting of 93,376,287 people shows a mild positive correlation between the proportion of Paraguayans and unemployment rate among population between the ages 30 and 34 in the United States with a correlation coefficient (R) of 0.321 and weighted average of 5.1%. Similarly, the statistical analysis conducted on geographies consisting of 130,935,949 people shows a substantial positive correlation between the proportion of Immigrants from Uruguay and unemployment rate among population between the ages 30 and 34 in the United States with a correlation coefficient (R) of 0.561 and weighted average of 5.3%, a difference of 3.6%.
Unemployment Among Ages 30 to 34 years Correlation Summary
| Measurement | Paraguayan | Immigrants from Uruguay |
| Minimum | 0.90% | 2.5% |
| Maximum | 18.3% | 53.3% |
| Range | 17.4% | 50.8% |
| Mean | 5.8% | 10.5% |
| Median | 5.3% | 5.5% |
| Interquartile 25% (IQ1) | 4.0% | 3.9% |
| Interquartile 75% (IQ3) | 6.5% | 10.8% |
| Interquartile Range (IQR) | 2.5% | 6.9% |
| Standard Deviation (Sample) | 3.1% | 13.9% |
| Standard Deviation (Population) | 3.1% | 13.4% |
Similar Demographics by Unemployment Among Ages 30 to 34 years
Demographics Similar to Paraguayans by Unemployment Among Ages 30 to 34 years
In terms of unemployment among ages 30 to 34 years, the demographic groups most similar to Paraguayans are Immigrants from Iraq (5.1%, a difference of 0.0%), Immigrants from Northern Africa (5.1%, a difference of 0.010%), Immigrants from Moldova (5.1%, a difference of 0.010%), Jordanian (5.1%, a difference of 0.020%), and Burmese (5.1%, a difference of 0.030%).
| Demographics | Rating | Rank | Unemployment Among Ages 30 to 34 years |
| Immigrants | Eastern Asia | 96.9 /100 | #64 | Exceptional 5.1% |
| Immigrants | Japan | 96.8 /100 | #65 | Exceptional 5.1% |
| Immigrants | Zimbabwe | 96.7 /100 | #66 | Exceptional 5.1% |
| Burmese | 96.5 /100 | #67 | Exceptional 5.1% |
| Jordanians | 96.5 /100 | #68 | Exceptional 5.1% |
| Immigrants | Northern Africa | 96.4 /100 | #69 | Exceptional 5.1% |
| Immigrants | Iraq | 96.4 /100 | #70 | Exceptional 5.1% |
| Paraguayans | 96.4 /100 | #71 | Exceptional 5.1% |
| Immigrants | Moldova | 96.4 /100 | #72 | Exceptional 5.1% |
| Slovenes | 96.2 /100 | #73 | Exceptional 5.2% |
| Immigrants | Asia | 96.2 /100 | #74 | Exceptional 5.2% |
| Iranians | 96.0 /100 | #75 | Exceptional 5.2% |
| Scandinavians | 95.6 /100 | #76 | Exceptional 5.2% |
| Uruguayans | 95.4 /100 | #77 | Exceptional 5.2% |
| Indonesians | 95.1 /100 | #78 | Exceptional 5.2% |
Demographics Similar to Immigrants from Uruguay by Unemployment Among Ages 30 to 34 years
In terms of unemployment among ages 30 to 34 years, the demographic groups most similar to Immigrants from Uruguay are Taiwanese (5.3%, a difference of 0.020%), Polish (5.3%, a difference of 0.060%), Immigrants from Sri Lanka (5.3%, a difference of 0.10%), Greek (5.3%, a difference of 0.12%), and German (5.3%, a difference of 0.16%).
| Demographics | Rating | Rank | Unemployment Among Ages 30 to 34 years |
| Romanians | 82.3 /100 | #121 | Excellent 5.3% |
| Immigrants | Netherlands | 81.8 /100 | #122 | Excellent 5.3% |
| Immigrants | Italy | 81.1 /100 | #123 | Excellent 5.3% |
| Immigrants | Brazil | 80.8 /100 | #124 | Excellent 5.3% |
| Greeks | 80.4 /100 | #125 | Excellent 5.3% |
| Immigrants | Sri Lanka | 80.2 /100 | #126 | Excellent 5.3% |
| Taiwanese | 79.4 /100 | #127 | Good 5.3% |
| Immigrants | Uruguay | 79.3 /100 | #128 | Good 5.3% |
| Poles | 78.8 /100 | #129 | Good 5.3% |
| Germans | 77.8 /100 | #130 | Good 5.3% |
| Immigrants | Eastern Europe | 77.4 /100 | #131 | Good 5.3% |
| Carpatho Rusyns | 77.3 /100 | #132 | Good 5.3% |
| Immigrants | Northern Europe | 77.3 /100 | #133 | Good 5.3% |
| Bangladeshis | 76.6 /100 | #134 | Good 5.3% |
| Palestinians | 75.1 /100 | #135 | Good 5.4% |