Uruguayan vs Immigrants from Micronesia 3rd Grade
COMPARE
Uruguayan
Immigrants from Micronesia
3rd Grade
3rd Grade Comparison
Uruguayans
Immigrants from Micronesia
97.5%
3RD GRADE
5.0/ 100
METRIC RATING
221st/ 347
METRIC RANK
97.8%
3RD GRADE
47.6/ 100
METRIC RATING
175th/ 347
METRIC RANK
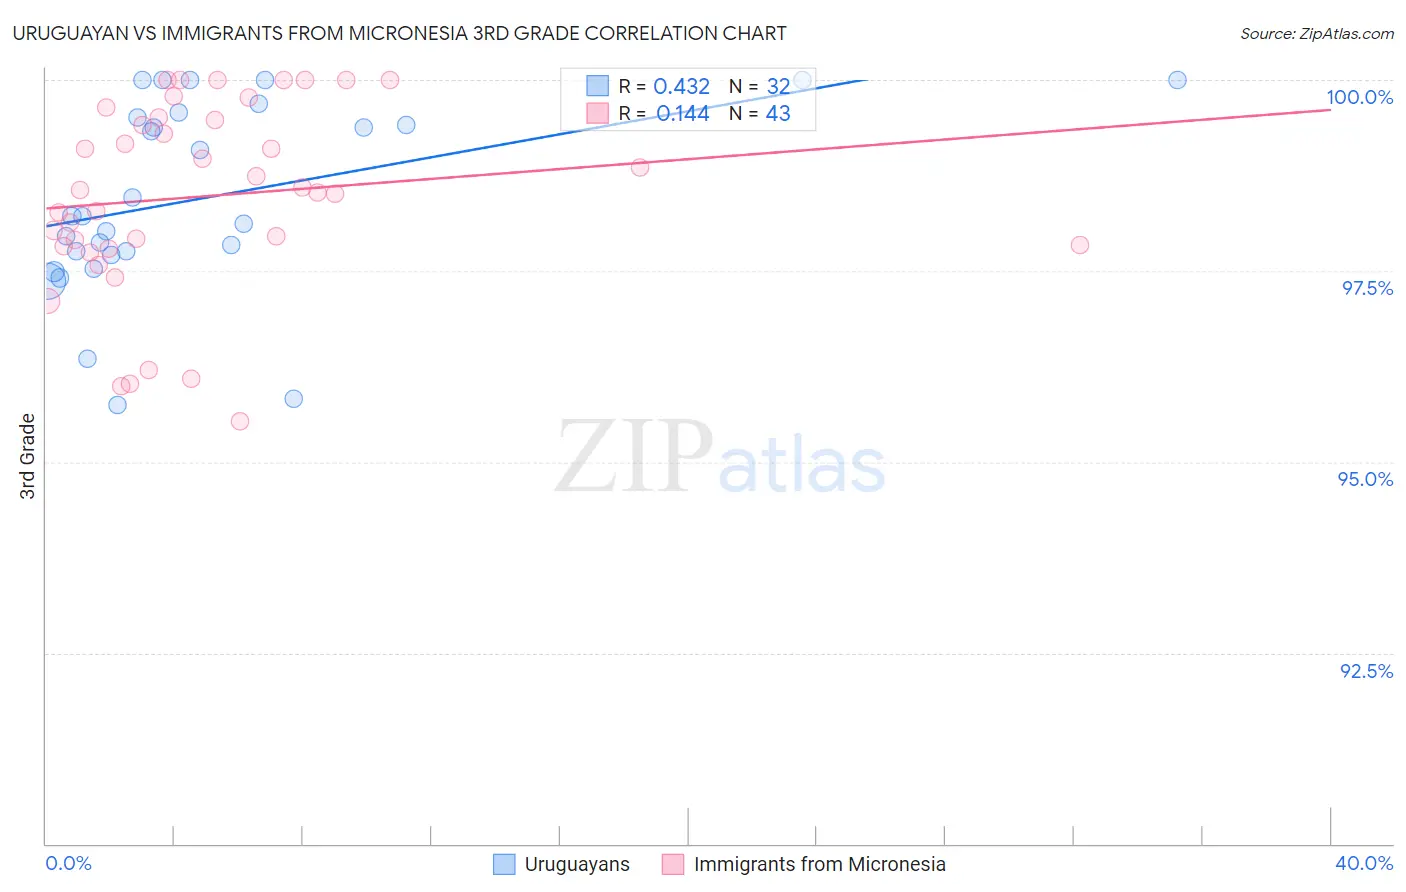
Uruguayan vs Immigrants from Micronesia 3rd Grade Correlation Chart
The statistical analysis conducted on geographies consisting of 144,782,794 people shows a moderate positive correlation between the proportion of Uruguayans and percentage of population with at least 3rd grade education in the United States with a correlation coefficient (R) of 0.432 and weighted average of 97.5%. Similarly, the statistical analysis conducted on geographies consisting of 61,604,657 people shows a poor positive correlation between the proportion of Immigrants from Micronesia and percentage of population with at least 3rd grade education in the United States with a correlation coefficient (R) of 0.144 and weighted average of 97.8%, a difference of 0.24%.
3rd Grade Correlation Summary
| Measurement | Uruguayan | Immigrants from Micronesia |
| Minimum | 95.7% | 95.5% |
| Maximum | 100.0% | 100.0% |
| Range | 4.3% | 4.5% |
| Mean | 98.5% | 98.5% |
| Median | 98.2% | 98.6% |
| Interquartile 25% (IQ1) | 97.7% | 97.8% |
| Interquartile 75% (IQ3) | 99.5% | 99.5% |
| Interquartile Range (IQR) | 1.8% | 1.7% |
| Standard Deviation (Sample) | 1.2% | 1.2% |
| Standard Deviation (Population) | 1.2% | 1.2% |
Similar Demographics by 3rd Grade
Demographics Similar to Uruguayans by 3rd Grade
In terms of 3rd grade, the demographic groups most similar to Uruguayans are Immigrants from Panama (97.5%, a difference of 0.0%), Immigrants from Morocco (97.5%, a difference of 0.0%), South American Indian (97.5%, a difference of 0.010%), Immigrants from Nepal (97.5%, a difference of 0.010%), and Sierra Leonean (97.5%, a difference of 0.010%).
| Demographics | Rating | Rank | 3rd Grade |
| Yuman | 8.4 /100 | #214 | Tragic 97.6% |
| Iraqis | 6.9 /100 | #215 | Tragic 97.5% |
| Samoans | 6.9 /100 | #216 | Tragic 97.5% |
| South American Indians | 5.7 /100 | #217 | Tragic 97.5% |
| Immigrants | Nepal | 5.3 /100 | #218 | Tragic 97.5% |
| Immigrants | Panama | 5.2 /100 | #219 | Tragic 97.5% |
| Immigrants | Morocco | 5.0 /100 | #220 | Tragic 97.5% |
| Uruguayans | 5.0 /100 | #221 | Tragic 97.5% |
| Sierra Leoneans | 4.6 /100 | #222 | Tragic 97.5% |
| Immigrants | Syria | 4.4 /100 | #223 | Tragic 97.5% |
| Bahamians | 4.4 /100 | #224 | Tragic 97.5% |
| Tongans | 4.3 /100 | #225 | Tragic 97.5% |
| Sudanese | 4.1 /100 | #226 | Tragic 97.5% |
| Immigrants | Sudan | 3.4 /100 | #227 | Tragic 97.5% |
| Sub-Saharan Africans | 3.2 /100 | #228 | Tragic 97.5% |
Demographics Similar to Immigrants from Micronesia by 3rd Grade
In terms of 3rd grade, the demographic groups most similar to Immigrants from Micronesia are Immigrants from Poland (97.8%, a difference of 0.0%), Egyptian (97.7%, a difference of 0.0%), Immigrants from Brazil (97.7%, a difference of 0.0%), Kenyan (97.8%, a difference of 0.010%), and Spanish American (97.8%, a difference of 0.010%).
| Demographics | Rating | Rank | 3rd Grade |
| Immigrants | Spain | 54.3 /100 | #168 | Average 97.8% |
| Comanche | 53.8 /100 | #169 | Average 97.8% |
| Brazilians | 53.7 /100 | #170 | Average 97.8% |
| Kenyans | 51.8 /100 | #171 | Average 97.8% |
| Spanish Americans | 51.8 /100 | #172 | Average 97.8% |
| Immigrants | Korea | 50.9 /100 | #173 | Average 97.8% |
| Navajo | 50.0 /100 | #174 | Average 97.8% |
| Immigrants | Micronesia | 47.6 /100 | #175 | Average 97.8% |
| Immigrants | Poland | 47.1 /100 | #176 | Average 97.8% |
| Egyptians | 46.6 /100 | #177 | Average 97.7% |
| Immigrants | Brazil | 46.4 /100 | #178 | Average 97.7% |
| Immigrants | Belarus | 45.9 /100 | #179 | Average 97.7% |
| Immigrants | Sri Lanka | 45.1 /100 | #180 | Average 97.7% |
| Immigrants | Venezuela | 44.4 /100 | #181 | Average 97.7% |
| Argentineans | 42.9 /100 | #182 | Average 97.7% |