Panamanian vs Iranian College, Under 1 year
COMPARE
Panamanian
Iranian
College, Under 1 year
College, Under 1 year Comparison
Panamanians
Iranians
64.3%
COLLEGE, UNDER 1 YEAR
17.0/ 100
METRIC RATING
199th/ 347
METRIC RANK
74.9%
COLLEGE, UNDER 1 YEAR
100.0/ 100
METRIC RATING
2nd/ 347
METRIC RANK
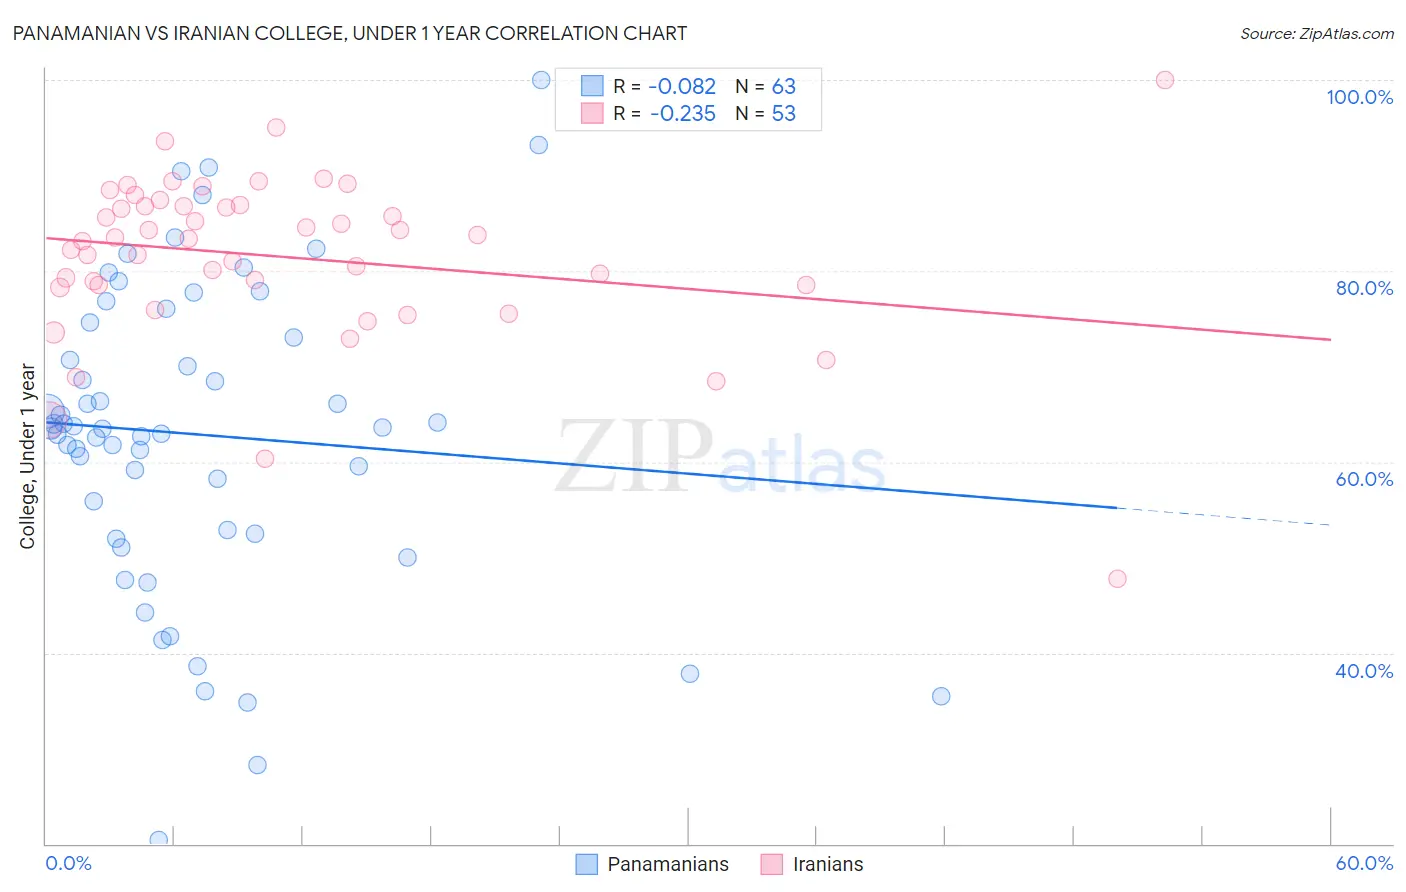
Panamanian vs Iranian College, Under 1 year Correlation Chart
The statistical analysis conducted on geographies consisting of 281,250,786 people shows a slight negative correlation between the proportion of Panamanians and percentage of population with at least college, under 1 year education in the United States with a correlation coefficient (R) of -0.082 and weighted average of 64.3%. Similarly, the statistical analysis conducted on geographies consisting of 316,900,663 people shows a weak negative correlation between the proportion of Iranians and percentage of population with at least college, under 1 year education in the United States with a correlation coefficient (R) of -0.235 and weighted average of 74.9%, a difference of 16.5%.
College, Under 1 year Correlation Summary
| Measurement | Panamanian | Iranian |
| Minimum | 20.4% | 47.7% |
| Maximum | 100.0% | 100.0% |
| Range | 79.6% | 52.3% |
| Mean | 62.9% | 81.5% |
| Median | 63.5% | 83.3% |
| Interquartile 25% (IQ1) | 52.5% | 78.4% |
| Interquartile 75% (IQ3) | 74.6% | 86.9% |
| Interquartile Range (IQR) | 22.0% | 8.5% |
| Standard Deviation (Sample) | 16.4% | 8.8% |
| Standard Deviation (Population) | 16.3% | 8.8% |
Similar Demographics by College, Under 1 year
Demographics Similar to Panamanians by College, Under 1 year
In terms of college, under 1 year, the demographic groups most similar to Panamanians are Nigerian (64.3%, a difference of 0.020%), French Canadian (64.2%, a difference of 0.060%), Tsimshian (64.3%, a difference of 0.070%), South American (64.2%, a difference of 0.070%), and Uruguayan (64.2%, a difference of 0.11%).
| Demographics | Rating | Rank | College, Under 1 year |
| Immigrants | Thailand | 27.0 /100 | #192 | Fair 64.7% |
| Slovaks | 26.7 /100 | #193 | Fair 64.7% |
| Immigrants | Cameroon | 24.6 /100 | #194 | Fair 64.6% |
| Immigrants | South Eastern Asia | 22.1 /100 | #195 | Fair 64.5% |
| Tongans | 21.2 /100 | #196 | Fair 64.5% |
| Costa Ricans | 19.6 /100 | #197 | Poor 64.4% |
| Tsimshian | 17.9 /100 | #198 | Poor 64.3% |
| Panamanians | 17.0 /100 | #199 | Poor 64.3% |
| Nigerians | 16.7 /100 | #200 | Poor 64.3% |
| French Canadians | 16.3 /100 | #201 | Poor 64.2% |
| South Americans | 16.2 /100 | #202 | Poor 64.2% |
| Uruguayans | 15.6 /100 | #203 | Poor 64.2% |
| Immigrants | Zaire | 14.6 /100 | #204 | Poor 64.1% |
| Peruvians | 13.7 /100 | #205 | Poor 64.1% |
| Whites/Caucasians | 12.8 /100 | #206 | Poor 64.0% |
Demographics Similar to Iranians by College, Under 1 year
In terms of college, under 1 year, the demographic groups most similar to Iranians are Immigrants from Singapore (74.8%, a difference of 0.050%), Immigrants from India (74.4%, a difference of 0.56%), Immigrants from Iran (74.3%, a difference of 0.79%), Filipino (75.5%, a difference of 0.85%), and Immigrants from Taiwan (74.2%, a difference of 0.90%).
| Demographics | Rating | Rank | College, Under 1 year |
| Filipinos | 100.0 /100 | #1 | Exceptional 75.5% |
| Iranians | 100.0 /100 | #2 | Exceptional 74.9% |
| Immigrants | Singapore | 100.0 /100 | #3 | Exceptional 74.8% |
| Immigrants | India | 100.0 /100 | #4 | Exceptional 74.4% |
| Immigrants | Iran | 100.0 /100 | #5 | Exceptional 74.3% |
| Immigrants | Taiwan | 100.0 /100 | #6 | Exceptional 74.2% |
| Okinawans | 100.0 /100 | #7 | Exceptional 73.7% |
| Thais | 100.0 /100 | #8 | Exceptional 73.4% |
| Immigrants | Australia | 100.0 /100 | #9 | Exceptional 72.7% |
| Immigrants | Israel | 100.0 /100 | #10 | Exceptional 72.3% |
| Immigrants | South Central Asia | 100.0 /100 | #11 | Exceptional 72.1% |
| Immigrants | Sweden | 100.0 /100 | #12 | Exceptional 72.1% |
| Cypriots | 100.0 /100 | #13 | Exceptional 72.0% |
| Cambodians | 100.0 /100 | #14 | Exceptional 71.9% |
| Burmese | 100.0 /100 | #15 | Exceptional 71.9% |