Korean vs Iranian College, Under 1 year
COMPARE
Korean
Iranian
College, Under 1 year
College, Under 1 year Comparison
Koreans
Iranians
65.9%
COLLEGE, UNDER 1 YEAR
65.3/ 100
METRIC RATING
162nd/ 347
METRIC RANK
74.9%
COLLEGE, UNDER 1 YEAR
100.0/ 100
METRIC RATING
2nd/ 347
METRIC RANK
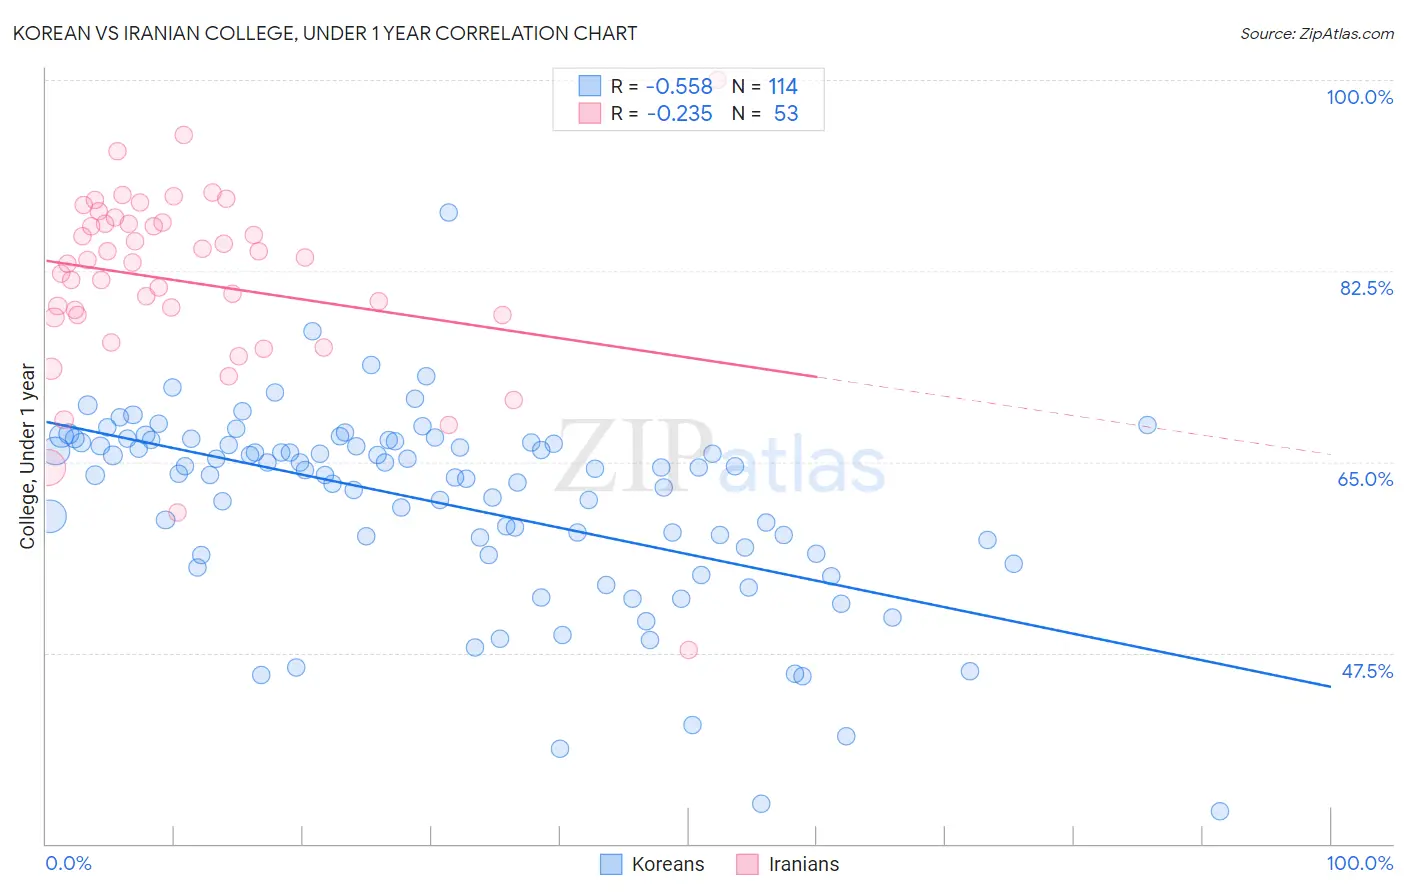
Korean vs Iranian College, Under 1 year Correlation Chart
The statistical analysis conducted on geographies consisting of 510,944,501 people shows a substantial negative correlation between the proportion of Koreans and percentage of population with at least college, under 1 year education in the United States with a correlation coefficient (R) of -0.558 and weighted average of 65.9%. Similarly, the statistical analysis conducted on geographies consisting of 316,900,663 people shows a weak negative correlation between the proportion of Iranians and percentage of population with at least college, under 1 year education in the United States with a correlation coefficient (R) of -0.235 and weighted average of 74.9%, a difference of 13.6%.
College, Under 1 year Correlation Summary
| Measurement | Korean | Iranian |
| Minimum | 33.0% | 47.7% |
| Maximum | 87.8% | 100.0% |
| Range | 54.8% | 52.3% |
| Mean | 61.2% | 81.5% |
| Median | 64.1% | 83.3% |
| Interquartile 25% (IQ1) | 56.5% | 78.4% |
| Interquartile 75% (IQ3) | 66.8% | 86.9% |
| Interquartile Range (IQR) | 10.2% | 8.5% |
| Standard Deviation (Sample) | 8.9% | 8.8% |
| Standard Deviation (Population) | 8.8% | 8.8% |
Similar Demographics by College, Under 1 year
Demographics Similar to Koreans by College, Under 1 year
In terms of college, under 1 year, the demographic groups most similar to Koreans are Brazilian (65.9%, a difference of 0.030%), Albanian (65.9%, a difference of 0.040%), Tlingit-Haida (65.9%, a difference of 0.050%), Celtic (65.9%, a difference of 0.10%), and Somali (65.8%, a difference of 0.12%).
| Demographics | Rating | Rank | College, Under 1 year |
| Irish | 70.3 /100 | #155 | Good 66.0% |
| Welsh | 69.9 /100 | #156 | Good 66.0% |
| Sierra Leoneans | 67.8 /100 | #157 | Good 66.0% |
| Celtics | 67.3 /100 | #158 | Good 65.9% |
| Tlingit-Haida | 66.4 /100 | #159 | Good 65.9% |
| Albanians | 66.1 /100 | #160 | Good 65.9% |
| Brazilians | 66.0 /100 | #161 | Good 65.9% |
| Koreans | 65.3 /100 | #162 | Good 65.9% |
| Somalis | 62.7 /100 | #163 | Good 65.8% |
| Czechoslovakians | 62.6 /100 | #164 | Good 65.8% |
| Immigrants | Uzbekistan | 61.6 /100 | #165 | Good 65.8% |
| Moroccans | 56.7 /100 | #166 | Average 65.6% |
| Immigrants | Somalia | 56.4 /100 | #167 | Average 65.6% |
| Hungarians | 55.9 /100 | #168 | Average 65.6% |
| Yugoslavians | 55.7 /100 | #169 | Average 65.6% |
Demographics Similar to Iranians by College, Under 1 year
In terms of college, under 1 year, the demographic groups most similar to Iranians are Immigrants from Singapore (74.8%, a difference of 0.050%), Immigrants from India (74.4%, a difference of 0.56%), Immigrants from Iran (74.3%, a difference of 0.79%), Filipino (75.5%, a difference of 0.85%), and Immigrants from Taiwan (74.2%, a difference of 0.90%).
| Demographics | Rating | Rank | College, Under 1 year |
| Filipinos | 100.0 /100 | #1 | Exceptional 75.5% |
| Iranians | 100.0 /100 | #2 | Exceptional 74.9% |
| Immigrants | Singapore | 100.0 /100 | #3 | Exceptional 74.8% |
| Immigrants | India | 100.0 /100 | #4 | Exceptional 74.4% |
| Immigrants | Iran | 100.0 /100 | #5 | Exceptional 74.3% |
| Immigrants | Taiwan | 100.0 /100 | #6 | Exceptional 74.2% |
| Okinawans | 100.0 /100 | #7 | Exceptional 73.7% |
| Thais | 100.0 /100 | #8 | Exceptional 73.4% |
| Immigrants | Australia | 100.0 /100 | #9 | Exceptional 72.7% |
| Immigrants | Israel | 100.0 /100 | #10 | Exceptional 72.3% |
| Immigrants | South Central Asia | 100.0 /100 | #11 | Exceptional 72.1% |
| Immigrants | Sweden | 100.0 /100 | #12 | Exceptional 72.1% |
| Cypriots | 100.0 /100 | #13 | Exceptional 72.0% |
| Cambodians | 100.0 /100 | #14 | Exceptional 71.9% |
| Burmese | 100.0 /100 | #15 | Exceptional 71.9% |