Panamanian vs Spanish American College, Under 1 year
COMPARE
Panamanian
Spanish American
College, Under 1 year
College, Under 1 year Comparison
Panamanians
Spanish Americans
64.3%
COLLEGE, UNDER 1 YEAR
17.0/ 100
METRIC RATING
199th/ 347
METRIC RANK
62.6%
COLLEGE, UNDER 1 YEAR
1.9/ 100
METRIC RATING
235th/ 347
METRIC RANK
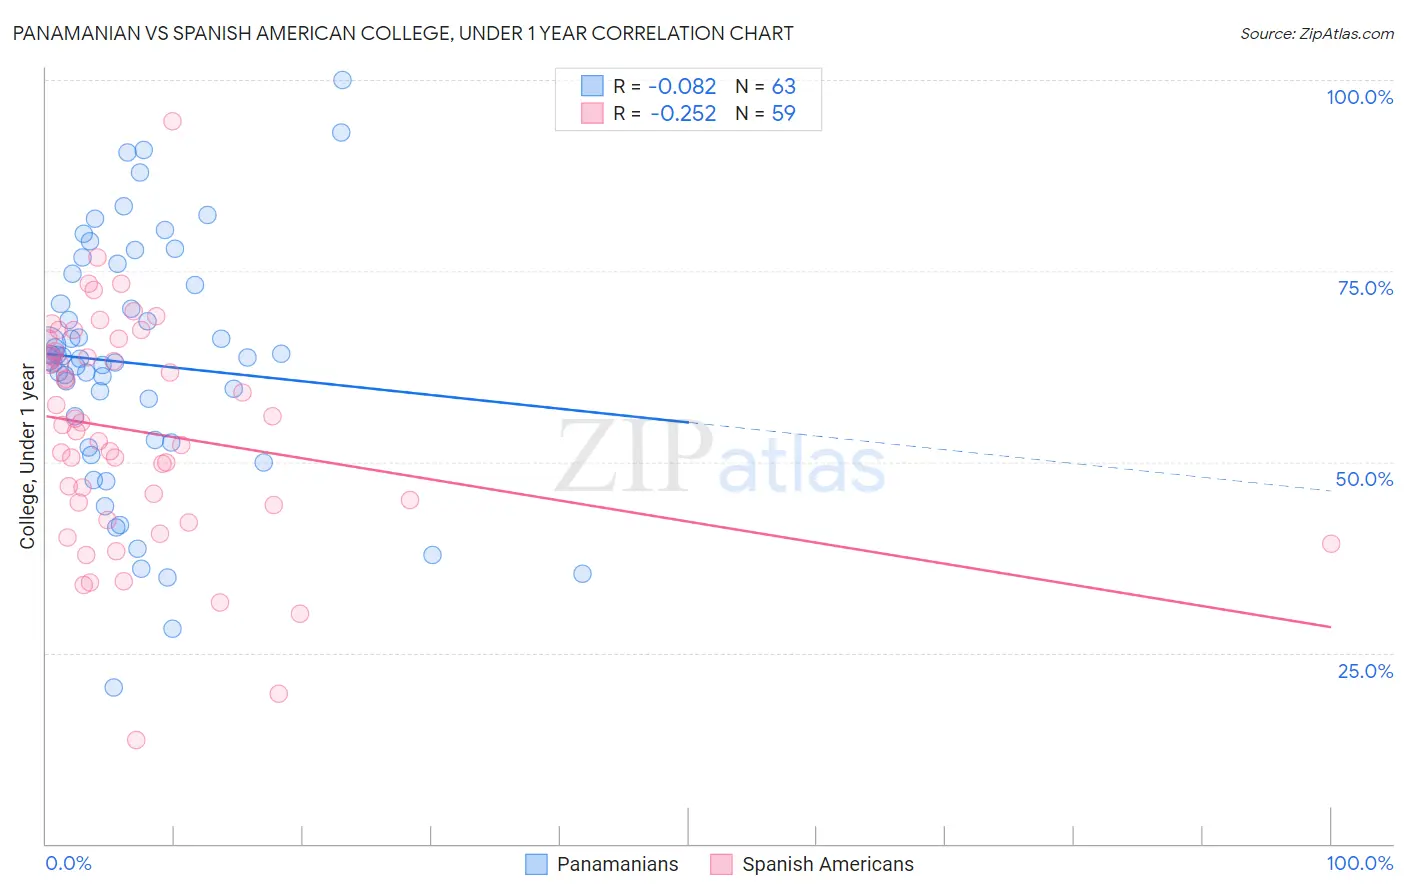
Panamanian vs Spanish American College, Under 1 year Correlation Chart
The statistical analysis conducted on geographies consisting of 281,250,786 people shows a slight negative correlation between the proportion of Panamanians and percentage of population with at least college, under 1 year education in the United States with a correlation coefficient (R) of -0.082 and weighted average of 64.3%. Similarly, the statistical analysis conducted on geographies consisting of 103,168,410 people shows a weak negative correlation between the proportion of Spanish Americans and percentage of population with at least college, under 1 year education in the United States with a correlation coefficient (R) of -0.252 and weighted average of 62.6%, a difference of 2.7%.
College, Under 1 year Correlation Summary
| Measurement | Panamanian | Spanish American |
| Minimum | 20.4% | 13.6% |
| Maximum | 100.0% | 94.7% |
| Range | 79.6% | 81.0% |
| Mean | 62.9% | 53.9% |
| Median | 63.5% | 54.9% |
| Interquartile 25% (IQ1) | 52.5% | 44.3% |
| Interquartile 75% (IQ3) | 74.6% | 64.5% |
| Interquartile Range (IQR) | 22.0% | 20.2% |
| Standard Deviation (Sample) | 16.4% | 14.8% |
| Standard Deviation (Population) | 16.3% | 14.7% |
Similar Demographics by College, Under 1 year
Demographics Similar to Panamanians by College, Under 1 year
In terms of college, under 1 year, the demographic groups most similar to Panamanians are Nigerian (64.3%, a difference of 0.020%), French Canadian (64.2%, a difference of 0.060%), Tsimshian (64.3%, a difference of 0.070%), South American (64.2%, a difference of 0.070%), and Uruguayan (64.2%, a difference of 0.11%).
| Demographics | Rating | Rank | College, Under 1 year |
| Immigrants | Thailand | 27.0 /100 | #192 | Fair 64.7% |
| Slovaks | 26.7 /100 | #193 | Fair 64.7% |
| Immigrants | Cameroon | 24.6 /100 | #194 | Fair 64.6% |
| Immigrants | South Eastern Asia | 22.1 /100 | #195 | Fair 64.5% |
| Tongans | 21.2 /100 | #196 | Fair 64.5% |
| Costa Ricans | 19.6 /100 | #197 | Poor 64.4% |
| Tsimshian | 17.9 /100 | #198 | Poor 64.3% |
| Panamanians | 17.0 /100 | #199 | Poor 64.3% |
| Nigerians | 16.7 /100 | #200 | Poor 64.3% |
| French Canadians | 16.3 /100 | #201 | Poor 64.2% |
| South Americans | 16.2 /100 | #202 | Poor 64.2% |
| Uruguayans | 15.6 /100 | #203 | Poor 64.2% |
| Immigrants | Zaire | 14.6 /100 | #204 | Poor 64.1% |
| Peruvians | 13.7 /100 | #205 | Poor 64.1% |
| Whites/Caucasians | 12.8 /100 | #206 | Poor 64.0% |
Demographics Similar to Spanish Americans by College, Under 1 year
In terms of college, under 1 year, the demographic groups most similar to Spanish Americans are Chippewa (62.6%, a difference of 0.050%), Iroquois (62.6%, a difference of 0.080%), Immigrants (62.5%, a difference of 0.13%), Immigrants from Burma/Myanmar (62.5%, a difference of 0.16%), and Osage (62.7%, a difference of 0.20%).
| Demographics | Rating | Rank | College, Under 1 year |
| Samoans | 3.3 /100 | #228 | Tragic 63.0% |
| Liberians | 3.2 /100 | #229 | Tragic 63.0% |
| Immigrants | Nonimmigrants | 3.0 /100 | #230 | Tragic 62.9% |
| Immigrants | Western Africa | 2.4 /100 | #231 | Tragic 62.8% |
| Osage | 2.2 /100 | #232 | Tragic 62.7% |
| Iroquois | 2.0 /100 | #233 | Tragic 62.6% |
| Chippewa | 2.0 /100 | #234 | Tragic 62.6% |
| Spanish Americans | 1.9 /100 | #235 | Tragic 62.6% |
| Immigrants | Immigrants | 1.7 /100 | #236 | Tragic 62.5% |
| Immigrants | Burma/Myanmar | 1.6 /100 | #237 | Tragic 62.5% |
| French American Indians | 1.5 /100 | #238 | Tragic 62.4% |
| Nepalese | 1.1 /100 | #239 | Tragic 62.2% |
| Aleuts | 1.1 /100 | #240 | Tragic 62.2% |
| Ottawa | 1.1 /100 | #241 | Tragic 62.2% |
| Malaysians | 1.1 /100 | #242 | Tragic 62.2% |