Panamanian vs Korean College, Under 1 year
COMPARE
Panamanian
Korean
College, Under 1 year
College, Under 1 year Comparison
Panamanians
Koreans
64.3%
COLLEGE, UNDER 1 YEAR
17.0/ 100
METRIC RATING
199th/ 347
METRIC RANK
65.9%
COLLEGE, UNDER 1 YEAR
65.3/ 100
METRIC RATING
162nd/ 347
METRIC RANK
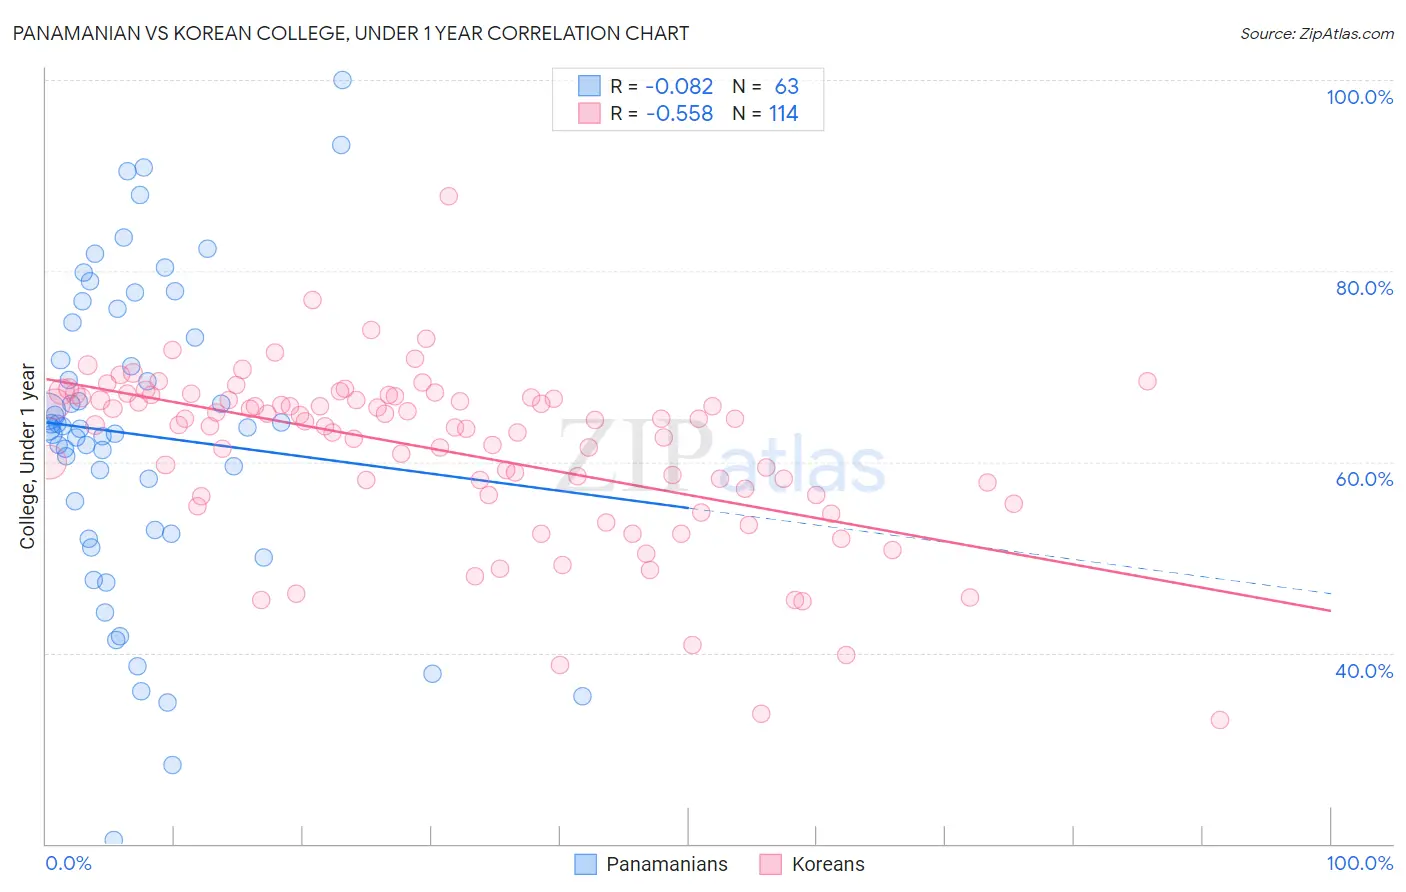
Panamanian vs Korean College, Under 1 year Correlation Chart
The statistical analysis conducted on geographies consisting of 281,250,786 people shows a slight negative correlation between the proportion of Panamanians and percentage of population with at least college, under 1 year education in the United States with a correlation coefficient (R) of -0.082 and weighted average of 64.3%. Similarly, the statistical analysis conducted on geographies consisting of 510,944,501 people shows a substantial negative correlation between the proportion of Koreans and percentage of population with at least college, under 1 year education in the United States with a correlation coefficient (R) of -0.558 and weighted average of 65.9%, a difference of 2.5%.
College, Under 1 year Correlation Summary
| Measurement | Panamanian | Korean |
| Minimum | 20.4% | 33.0% |
| Maximum | 100.0% | 87.8% |
| Range | 79.6% | 54.8% |
| Mean | 62.9% | 61.2% |
| Median | 63.5% | 64.1% |
| Interquartile 25% (IQ1) | 52.5% | 56.5% |
| Interquartile 75% (IQ3) | 74.6% | 66.8% |
| Interquartile Range (IQR) | 22.0% | 10.2% |
| Standard Deviation (Sample) | 16.4% | 8.9% |
| Standard Deviation (Population) | 16.3% | 8.8% |
Similar Demographics by College, Under 1 year
Demographics Similar to Panamanians by College, Under 1 year
In terms of college, under 1 year, the demographic groups most similar to Panamanians are Nigerian (64.3%, a difference of 0.020%), French Canadian (64.2%, a difference of 0.060%), Tsimshian (64.3%, a difference of 0.070%), South American (64.2%, a difference of 0.070%), and Uruguayan (64.2%, a difference of 0.11%).
| Demographics | Rating | Rank | College, Under 1 year |
| Immigrants | Thailand | 27.0 /100 | #192 | Fair 64.7% |
| Slovaks | 26.7 /100 | #193 | Fair 64.7% |
| Immigrants | Cameroon | 24.6 /100 | #194 | Fair 64.6% |
| Immigrants | South Eastern Asia | 22.1 /100 | #195 | Fair 64.5% |
| Tongans | 21.2 /100 | #196 | Fair 64.5% |
| Costa Ricans | 19.6 /100 | #197 | Poor 64.4% |
| Tsimshian | 17.9 /100 | #198 | Poor 64.3% |
| Panamanians | 17.0 /100 | #199 | Poor 64.3% |
| Nigerians | 16.7 /100 | #200 | Poor 64.3% |
| French Canadians | 16.3 /100 | #201 | Poor 64.2% |
| South Americans | 16.2 /100 | #202 | Poor 64.2% |
| Uruguayans | 15.6 /100 | #203 | Poor 64.2% |
| Immigrants | Zaire | 14.6 /100 | #204 | Poor 64.1% |
| Peruvians | 13.7 /100 | #205 | Poor 64.1% |
| Whites/Caucasians | 12.8 /100 | #206 | Poor 64.0% |
Demographics Similar to Koreans by College, Under 1 year
In terms of college, under 1 year, the demographic groups most similar to Koreans are Brazilian (65.9%, a difference of 0.030%), Albanian (65.9%, a difference of 0.040%), Tlingit-Haida (65.9%, a difference of 0.050%), Celtic (65.9%, a difference of 0.10%), and Somali (65.8%, a difference of 0.12%).
| Demographics | Rating | Rank | College, Under 1 year |
| Irish | 70.3 /100 | #155 | Good 66.0% |
| Welsh | 69.9 /100 | #156 | Good 66.0% |
| Sierra Leoneans | 67.8 /100 | #157 | Good 66.0% |
| Celtics | 67.3 /100 | #158 | Good 65.9% |
| Tlingit-Haida | 66.4 /100 | #159 | Good 65.9% |
| Albanians | 66.1 /100 | #160 | Good 65.9% |
| Brazilians | 66.0 /100 | #161 | Good 65.9% |
| Koreans | 65.3 /100 | #162 | Good 65.9% |
| Somalis | 62.7 /100 | #163 | Good 65.8% |
| Czechoslovakians | 62.6 /100 | #164 | Good 65.8% |
| Immigrants | Uzbekistan | 61.6 /100 | #165 | Good 65.8% |
| Moroccans | 56.7 /100 | #166 | Average 65.6% |
| Immigrants | Somalia | 56.4 /100 | #167 | Average 65.6% |
| Hungarians | 55.9 /100 | #168 | Average 65.6% |
| Yugoslavians | 55.7 /100 | #169 | Average 65.6% |