Blackfeet vs Iranian College, Under 1 year
COMPARE
Blackfeet
Iranian
College, Under 1 year
College, Under 1 year Comparison
Blackfeet
Iranians
61.1%
COLLEGE, UNDER 1 YEAR
0.3/ 100
METRIC RATING
260th/ 347
METRIC RANK
74.9%
COLLEGE, UNDER 1 YEAR
100.0/ 100
METRIC RATING
2nd/ 347
METRIC RANK
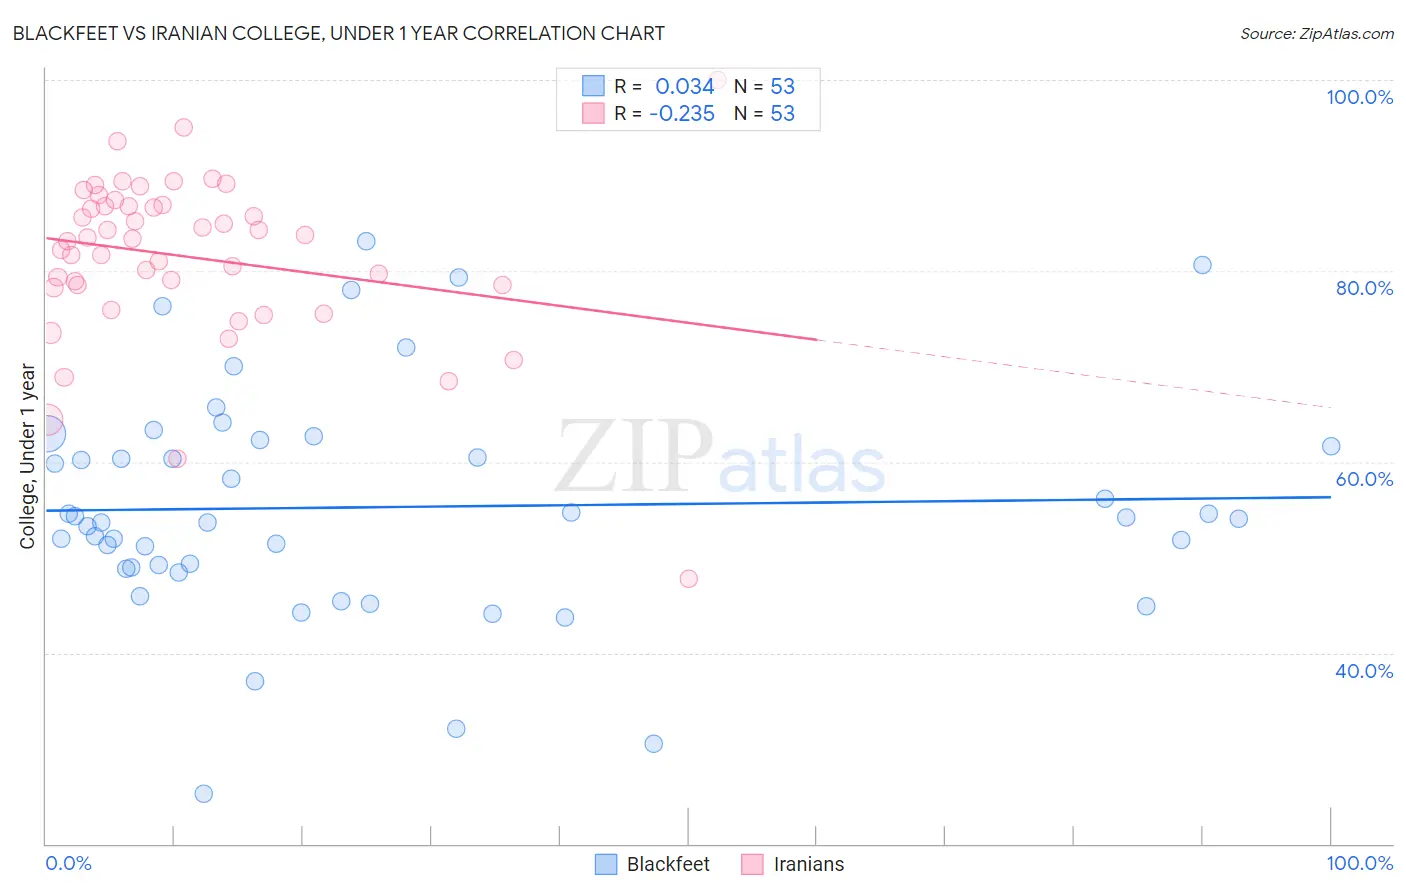
Blackfeet vs Iranian College, Under 1 year Correlation Chart
The statistical analysis conducted on geographies consisting of 309,581,838 people shows no correlation between the proportion of Blackfeet and percentage of population with at least college, under 1 year education in the United States with a correlation coefficient (R) of 0.034 and weighted average of 61.1%. Similarly, the statistical analysis conducted on geographies consisting of 316,900,663 people shows a weak negative correlation between the proportion of Iranians and percentage of population with at least college, under 1 year education in the United States with a correlation coefficient (R) of -0.235 and weighted average of 74.9%, a difference of 22.4%.
College, Under 1 year Correlation Summary
| Measurement | Blackfeet | Iranian |
| Minimum | 25.2% | 47.7% |
| Maximum | 83.1% | 100.0% |
| Range | 57.8% | 52.3% |
| Mean | 55.3% | 81.5% |
| Median | 54.0% | 83.3% |
| Interquartile 25% (IQ1) | 48.9% | 78.4% |
| Interquartile 75% (IQ3) | 62.0% | 86.9% |
| Interquartile Range (IQR) | 13.1% | 8.5% |
| Standard Deviation (Sample) | 12.0% | 8.8% |
| Standard Deviation (Population) | 11.9% | 8.8% |
Similar Demographics by College, Under 1 year
Demographics Similar to Blackfeet by College, Under 1 year
In terms of college, under 1 year, the demographic groups most similar to Blackfeet are African (61.1%, a difference of 0.030%), Barbadian (61.1%, a difference of 0.070%), Shoshone (61.1%, a difference of 0.070%), Trinidadian and Tobagonian (61.1%, a difference of 0.13%), and Immigrants from Bahamas (61.1%, a difference of 0.13%).
| Demographics | Rating | Rank | College, Under 1 year |
| Japanese | 0.4 /100 | #253 | Tragic 61.5% |
| Immigrants | Cambodia | 0.4 /100 | #254 | Tragic 61.5% |
| Comanche | 0.4 /100 | #255 | Tragic 61.4% |
| Bangladeshis | 0.4 /100 | #256 | Tragic 61.4% |
| Immigrants | Laos | 0.3 /100 | #257 | Tragic 61.3% |
| Immigrants | Bangladesh | 0.3 /100 | #258 | Tragic 61.3% |
| Indonesians | 0.3 /100 | #259 | Tragic 61.2% |
| Blackfeet | 0.3 /100 | #260 | Tragic 61.1% |
| Africans | 0.3 /100 | #261 | Tragic 61.1% |
| Barbadians | 0.2 /100 | #262 | Tragic 61.1% |
| Shoshone | 0.2 /100 | #263 | Tragic 61.1% |
| Trinidadians and Tobagonians | 0.2 /100 | #264 | Tragic 61.1% |
| Immigrants | Bahamas | 0.2 /100 | #265 | Tragic 61.1% |
| Alaskan Athabascans | 0.2 /100 | #266 | Tragic 61.0% |
| Americans | 0.2 /100 | #267 | Tragic 61.0% |
Demographics Similar to Iranians by College, Under 1 year
In terms of college, under 1 year, the demographic groups most similar to Iranians are Immigrants from Singapore (74.8%, a difference of 0.050%), Immigrants from India (74.4%, a difference of 0.56%), Immigrants from Iran (74.3%, a difference of 0.79%), Filipino (75.5%, a difference of 0.85%), and Immigrants from Taiwan (74.2%, a difference of 0.90%).
| Demographics | Rating | Rank | College, Under 1 year |
| Filipinos | 100.0 /100 | #1 | Exceptional 75.5% |
| Iranians | 100.0 /100 | #2 | Exceptional 74.9% |
| Immigrants | Singapore | 100.0 /100 | #3 | Exceptional 74.8% |
| Immigrants | India | 100.0 /100 | #4 | Exceptional 74.4% |
| Immigrants | Iran | 100.0 /100 | #5 | Exceptional 74.3% |
| Immigrants | Taiwan | 100.0 /100 | #6 | Exceptional 74.2% |
| Okinawans | 100.0 /100 | #7 | Exceptional 73.7% |
| Thais | 100.0 /100 | #8 | Exceptional 73.4% |
| Immigrants | Australia | 100.0 /100 | #9 | Exceptional 72.7% |
| Immigrants | Israel | 100.0 /100 | #10 | Exceptional 72.3% |
| Immigrants | South Central Asia | 100.0 /100 | #11 | Exceptional 72.1% |
| Immigrants | Sweden | 100.0 /100 | #12 | Exceptional 72.1% |
| Cypriots | 100.0 /100 | #13 | Exceptional 72.0% |
| Cambodians | 100.0 /100 | #14 | Exceptional 71.9% |
| Burmese | 100.0 /100 | #15 | Exceptional 71.9% |