Panamanian vs Immigrants from England Bachelor's Degree
COMPARE
Panamanian
Immigrants from England
Bachelor's Degree
Bachelor's Degree Comparison
Panamanians
Immigrants from England
36.5%
BACHELOR'S DEGREE
18.8/ 100
METRIC RATING
209th/ 347
METRIC RANK
41.4%
BACHELOR'S DEGREE
98.1/ 100
METRIC RATING
99th/ 347
METRIC RANK
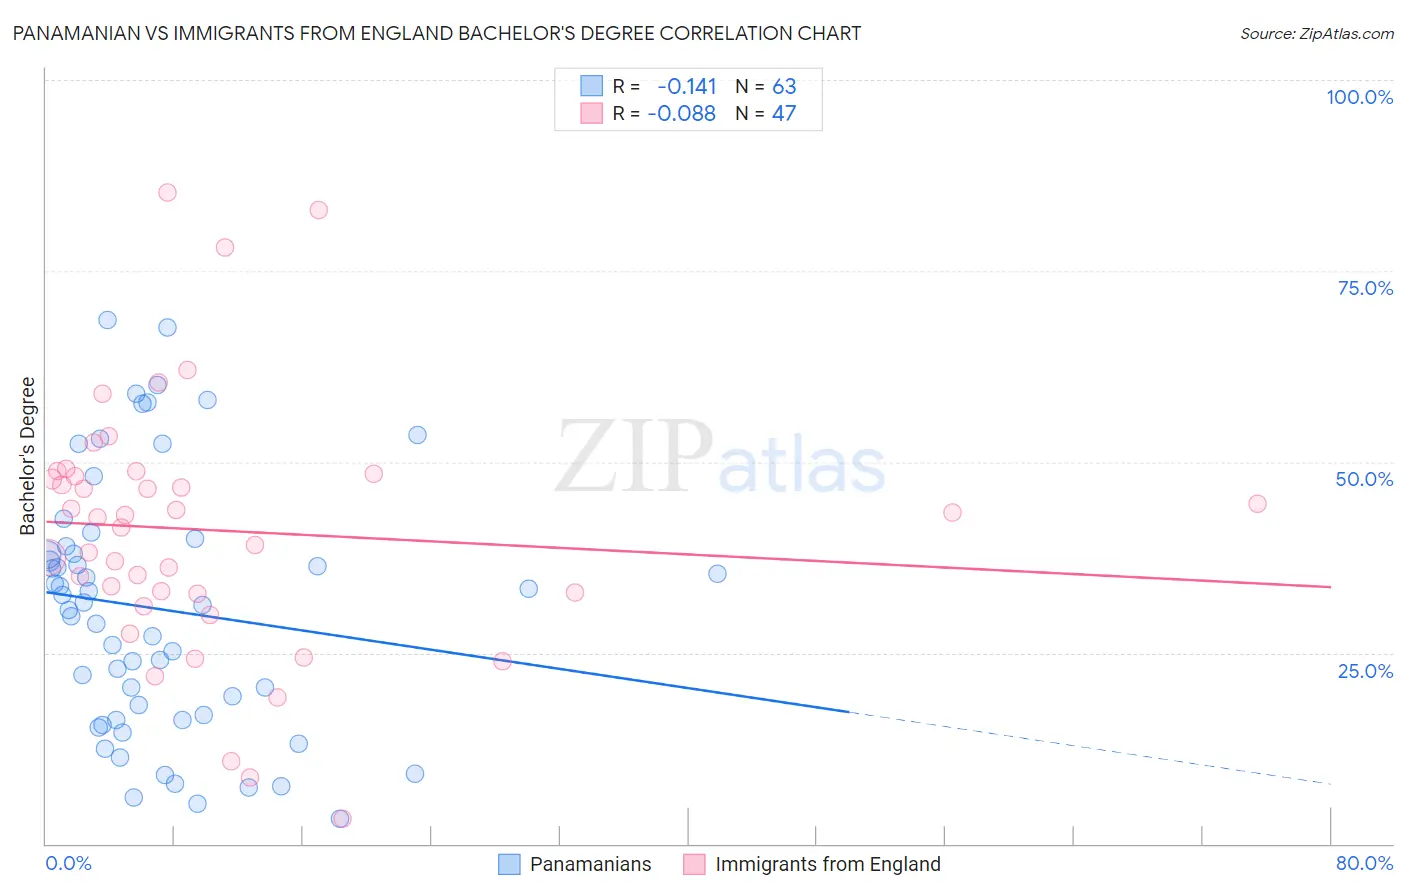
Panamanian vs Immigrants from England Bachelor's Degree Correlation Chart
The statistical analysis conducted on geographies consisting of 281,235,018 people shows a poor negative correlation between the proportion of Panamanians and percentage of population with at least bachelor's degree education in the United States with a correlation coefficient (R) of -0.141 and weighted average of 36.5%. Similarly, the statistical analysis conducted on geographies consisting of 391,879,677 people shows a slight negative correlation between the proportion of Immigrants from England and percentage of population with at least bachelor's degree education in the United States with a correlation coefficient (R) of -0.088 and weighted average of 41.4%, a difference of 13.6%.
Bachelor's Degree Correlation Summary
| Measurement | Panamanian | Immigrants from England |
| Minimum | 3.2% | 3.3% |
| Maximum | 68.6% | 85.3% |
| Range | 65.4% | 82.0% |
| Mean | 30.7% | 41.0% |
| Median | 31.3% | 42.7% |
| Interquartile 25% (IQ1) | 16.2% | 32.7% |
| Interquartile 75% (IQ3) | 38.9% | 48.4% |
| Interquartile Range (IQR) | 22.7% | 15.7% |
| Standard Deviation (Sample) | 16.7% | 16.7% |
| Standard Deviation (Population) | 16.6% | 16.6% |
Similar Demographics by Bachelor's Degree
Demographics Similar to Panamanians by Bachelor's Degree
In terms of bachelor's degree, the demographic groups most similar to Panamanians are French (36.5%, a difference of 0.030%), Scotch-Irish (36.4%, a difference of 0.080%), Immigrants from Thailand (36.5%, a difference of 0.10%), Immigrants from Philippines (36.4%, a difference of 0.16%), and Immigrants from Middle Africa (36.6%, a difference of 0.30%).
| Demographics | Rating | Rank | Bachelor's Degree |
| Immigrants | Zaire | 25.3 /100 | #202 | Fair 36.8% |
| Immigrants | Nigeria | 23.1 /100 | #203 | Fair 36.7% |
| Immigrants | Immigrants | 22.8 /100 | #204 | Fair 36.7% |
| Finns | 22.2 /100 | #205 | Fair 36.7% |
| Spaniards | 21.2 /100 | #206 | Fair 36.6% |
| Immigrants | Middle Africa | 20.6 /100 | #207 | Fair 36.6% |
| Immigrants | Thailand | 19.4 /100 | #208 | Poor 36.5% |
| Panamanians | 18.8 /100 | #209 | Poor 36.5% |
| French | 18.6 /100 | #210 | Poor 36.5% |
| Scotch-Irish | 18.3 /100 | #211 | Poor 36.4% |
| Immigrants | Philippines | 17.8 /100 | #212 | Poor 36.4% |
| Immigrants | Panama | 14.2 /100 | #213 | Poor 36.2% |
| Germans | 13.9 /100 | #214 | Poor 36.1% |
| Immigrants | Western Africa | 13.8 /100 | #215 | Poor 36.1% |
| Barbadians | 13.5 /100 | #216 | Poor 36.1% |
Demographics Similar to Immigrants from England by Bachelor's Degree
In terms of bachelor's degree, the demographic groups most similar to Immigrants from England are Macedonian (41.4%, a difference of 0.030%), Immigrants from Morocco (41.4%, a difference of 0.060%), Immigrants from Ukraine (41.5%, a difference of 0.24%), Immigrants from Italy (41.3%, a difference of 0.32%), and Romanian (41.6%, a difference of 0.35%).
| Demographics | Rating | Rank | Bachelor's Degree |
| Maltese | 98.8 /100 | #92 | Exceptional 41.9% |
| Immigrants | Canada | 98.6 /100 | #93 | Exceptional 41.7% |
| Immigrants | Nepal | 98.6 /100 | #94 | Exceptional 41.7% |
| Immigrants | North America | 98.5 /100 | #95 | Exceptional 41.7% |
| Immigrants | Moldova | 98.4 /100 | #96 | Exceptional 41.6% |
| Romanians | 98.4 /100 | #97 | Exceptional 41.6% |
| Immigrants | Ukraine | 98.3 /100 | #98 | Exceptional 41.5% |
| Immigrants | England | 98.1 /100 | #99 | Exceptional 41.4% |
| Macedonians | 98.1 /100 | #100 | Exceptional 41.4% |
| Immigrants | Morocco | 98.0 /100 | #101 | Exceptional 41.4% |
| Immigrants | Italy | 97.8 /100 | #102 | Exceptional 41.3% |
| Chileans | 97.5 /100 | #103 | Exceptional 41.2% |
| Jordanians | 97.4 /100 | #104 | Exceptional 41.2% |
| Syrians | 97.4 /100 | #105 | Exceptional 41.1% |
| Alsatians | 97.0 /100 | #106 | Exceptional 41.0% |