Panamanian vs Immigrants from Serbia Bachelor's Degree
COMPARE
Panamanian
Immigrants from Serbia
Bachelor's Degree
Bachelor's Degree Comparison
Panamanians
Immigrants from Serbia
36.5%
BACHELOR'S DEGREE
18.8/ 100
METRIC RATING
209th/ 347
METRIC RANK
44.1%
BACHELOR'S DEGREE
99.9/ 100
METRIC RATING
56th/ 347
METRIC RANK
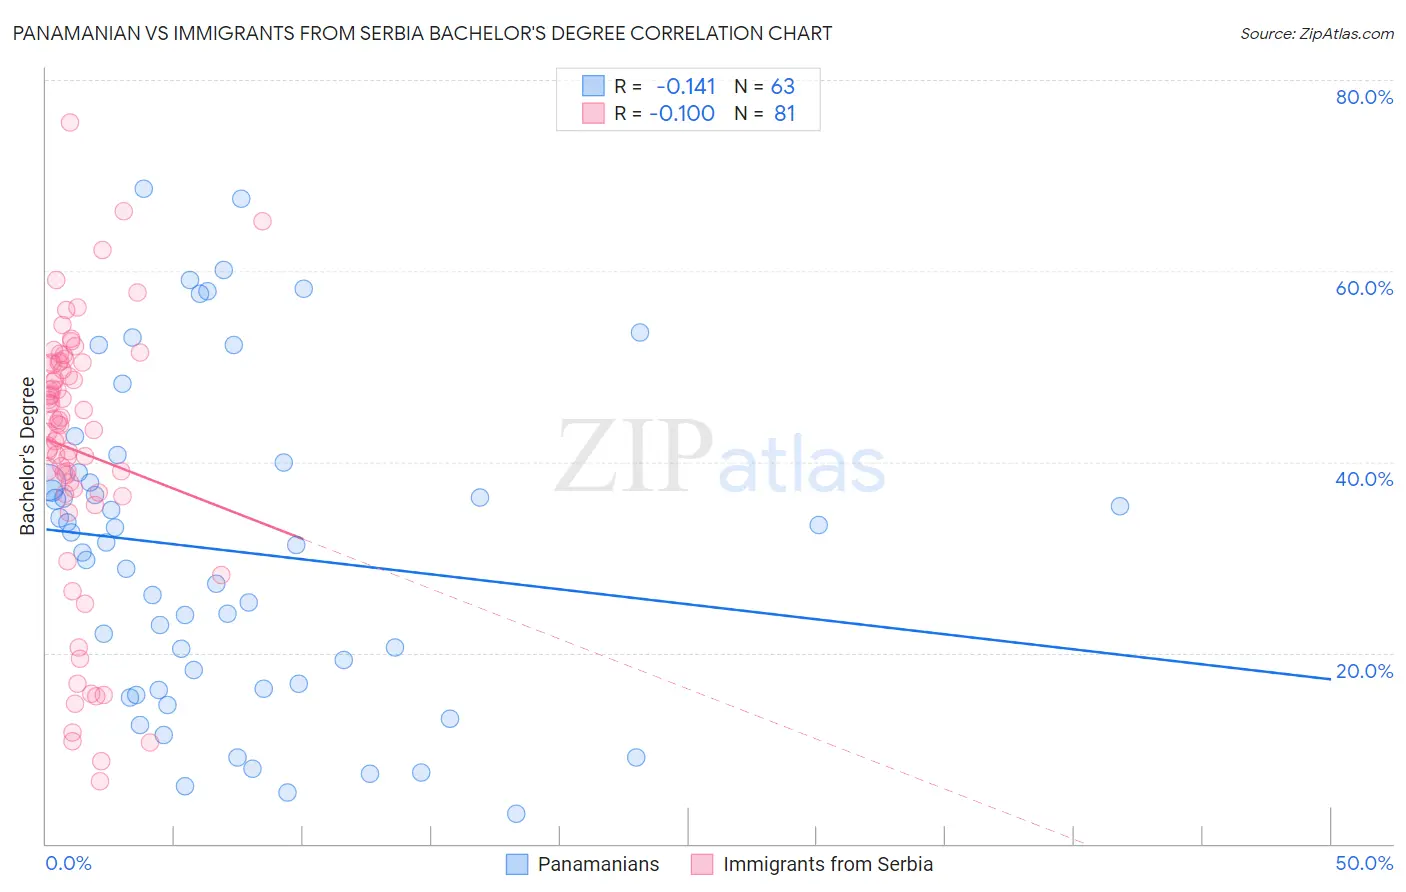
Panamanian vs Immigrants from Serbia Bachelor's Degree Correlation Chart
The statistical analysis conducted on geographies consisting of 281,235,018 people shows a poor negative correlation between the proportion of Panamanians and percentage of population with at least bachelor's degree education in the United States with a correlation coefficient (R) of -0.141 and weighted average of 36.5%. Similarly, the statistical analysis conducted on geographies consisting of 131,744,029 people shows a poor negative correlation between the proportion of Immigrants from Serbia and percentage of population with at least bachelor's degree education in the United States with a correlation coefficient (R) of -0.100 and weighted average of 44.1%, a difference of 21.0%.
Bachelor's Degree Correlation Summary
| Measurement | Panamanian | Immigrants from Serbia |
| Minimum | 3.2% | 6.6% |
| Maximum | 68.6% | 75.5% |
| Range | 65.4% | 69.0% |
| Mean | 30.7% | 41.1% |
| Median | 31.3% | 44.0% |
| Interquartile 25% (IQ1) | 16.2% | 36.7% |
| Interquartile 75% (IQ3) | 38.9% | 50.4% |
| Interquartile Range (IQR) | 22.7% | 13.6% |
| Standard Deviation (Sample) | 16.7% | 14.2% |
| Standard Deviation (Population) | 16.6% | 14.1% |
Similar Demographics by Bachelor's Degree
Demographics Similar to Panamanians by Bachelor's Degree
In terms of bachelor's degree, the demographic groups most similar to Panamanians are French (36.5%, a difference of 0.030%), Scotch-Irish (36.4%, a difference of 0.080%), Immigrants from Thailand (36.5%, a difference of 0.10%), Immigrants from Philippines (36.4%, a difference of 0.16%), and Immigrants from Middle Africa (36.6%, a difference of 0.30%).
| Demographics | Rating | Rank | Bachelor's Degree |
| Immigrants | Zaire | 25.3 /100 | #202 | Fair 36.8% |
| Immigrants | Nigeria | 23.1 /100 | #203 | Fair 36.7% |
| Immigrants | Immigrants | 22.8 /100 | #204 | Fair 36.7% |
| Finns | 22.2 /100 | #205 | Fair 36.7% |
| Spaniards | 21.2 /100 | #206 | Fair 36.6% |
| Immigrants | Middle Africa | 20.6 /100 | #207 | Fair 36.6% |
| Immigrants | Thailand | 19.4 /100 | #208 | Poor 36.5% |
| Panamanians | 18.8 /100 | #209 | Poor 36.5% |
| French | 18.6 /100 | #210 | Poor 36.5% |
| Scotch-Irish | 18.3 /100 | #211 | Poor 36.4% |
| Immigrants | Philippines | 17.8 /100 | #212 | Poor 36.4% |
| Immigrants | Panama | 14.2 /100 | #213 | Poor 36.2% |
| Germans | 13.9 /100 | #214 | Poor 36.1% |
| Immigrants | Western Africa | 13.8 /100 | #215 | Poor 36.1% |
| Barbadians | 13.5 /100 | #216 | Poor 36.1% |
Demographics Similar to Immigrants from Serbia by Bachelor's Degree
In terms of bachelor's degree, the demographic groups most similar to Immigrants from Serbia are Immigrants from Bolivia (44.2%, a difference of 0.18%), Immigrants from Austria (44.2%, a difference of 0.19%), Paraguayan (44.0%, a difference of 0.19%), Immigrants from Czechoslovakia (44.0%, a difference of 0.24%), and Australian (44.0%, a difference of 0.34%).
| Demographics | Rating | Rank | Bachelor's Degree |
| Immigrants | Norway | 99.9 /100 | #49 | Exceptional 44.5% |
| Immigrants | Greece | 99.9 /100 | #50 | Exceptional 44.5% |
| Asians | 99.9 /100 | #51 | Exceptional 44.4% |
| Immigrants | Spain | 99.9 /100 | #52 | Exceptional 44.3% |
| Immigrants | Asia | 99.9 /100 | #53 | Exceptional 44.3% |
| Immigrants | Austria | 99.9 /100 | #54 | Exceptional 44.2% |
| Immigrants | Bolivia | 99.9 /100 | #55 | Exceptional 44.2% |
| Immigrants | Serbia | 99.9 /100 | #56 | Exceptional 44.1% |
| Paraguayans | 99.9 /100 | #57 | Exceptional 44.0% |
| Immigrants | Czechoslovakia | 99.9 /100 | #58 | Exceptional 44.0% |
| Australians | 99.9 /100 | #59 | Exceptional 44.0% |
| New Zealanders | 99.9 /100 | #60 | Exceptional 44.0% |
| South Africans | 99.8 /100 | #61 | Exceptional 43.6% |
| Immigrants | Kazakhstan | 99.8 /100 | #62 | Exceptional 43.4% |
| Immigrants | Europe | 99.8 /100 | #63 | Exceptional 43.4% |