Panamanian vs Native/Alaskan 7th Grade
COMPARE
Panamanian
Native/Alaskan
7th Grade
7th Grade Comparison
Panamanians
Natives/Alaskans
95.9%
7TH GRADE
32.3/ 100
METRIC RATING
192nd/ 347
METRIC RANK
95.6%
7TH GRADE
4.2/ 100
METRIC RATING
230th/ 347
METRIC RANK
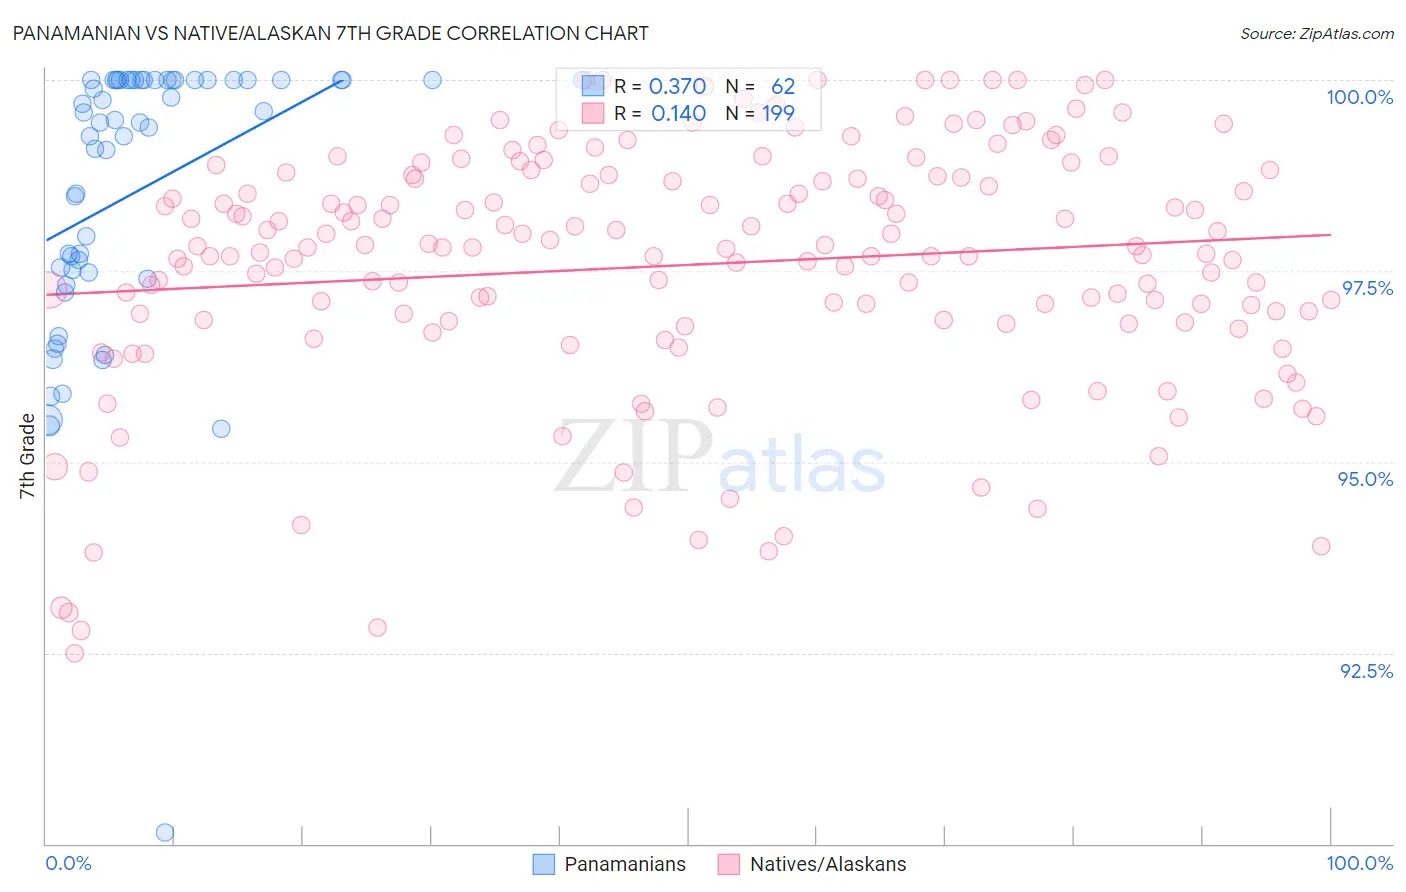
Panamanian vs Native/Alaskan 7th Grade Correlation Chart
The statistical analysis conducted on geographies consisting of 281,248,945 people shows a mild positive correlation between the proportion of Panamanians and percentage of population with at least 7th grade education in the United States with a correlation coefficient (R) of 0.370 and weighted average of 95.9%. Similarly, the statistical analysis conducted on geographies consisting of 513,072,559 people shows a poor positive correlation between the proportion of Natives/Alaskans and percentage of population with at least 7th grade education in the United States with a correlation coefficient (R) of 0.140 and weighted average of 95.6%, a difference of 0.37%.
7th Grade Correlation Summary
| Measurement | Panamanian | Native/Alaskan |
| Minimum | 90.1% | 92.5% |
| Maximum | 100.0% | 100.0% |
| Range | 9.9% | 7.5% |
| Mean | 98.5% | 97.6% |
| Median | 99.5% | 97.8% |
| Interquartile 25% (IQ1) | 97.5% | 96.8% |
| Interquartile 75% (IQ3) | 100.0% | 98.7% |
| Interquartile Range (IQR) | 2.5% | 1.9% |
| Standard Deviation (Sample) | 1.9% | 1.6% |
| Standard Deviation (Population) | 1.8% | 1.6% |
Similar Demographics by 7th Grade
Demographics Similar to Panamanians by 7th Grade
In terms of 7th grade, the demographic groups most similar to Panamanians are Immigrants from Micronesia (95.9%, a difference of 0.0%), Liberian (95.9%, a difference of 0.0%), Immigrants from Egypt (95.9%, a difference of 0.010%), Immigrants from Venezuela (95.9%, a difference of 0.010%), and Immigrants from Bahamas (95.9%, a difference of 0.010%).
| Demographics | Rating | Rank | 7th Grade |
| Brazilians | 37.3 /100 | #185 | Fair 96.0% |
| Immigrants | Iraq | 36.1 /100 | #186 | Fair 96.0% |
| Immigrants | Uganda | 36.0 /100 | #187 | Fair 96.0% |
| Immigrants | Egypt | 34.3 /100 | #188 | Fair 95.9% |
| Immigrants | Venezuela | 33.9 /100 | #189 | Fair 95.9% |
| Immigrants | Micronesia | 32.6 /100 | #190 | Fair 95.9% |
| Liberians | 32.5 /100 | #191 | Fair 95.9% |
| Panamanians | 32.3 /100 | #192 | Fair 95.9% |
| Immigrants | Bahamas | 30.8 /100 | #193 | Fair 95.9% |
| Immigrants | Nepal | 30.0 /100 | #194 | Fair 95.9% |
| Sudanese | 28.1 /100 | #195 | Fair 95.9% |
| Apache | 27.6 /100 | #196 | Fair 95.9% |
| Immigrants | Zaire | 26.7 /100 | #197 | Fair 95.9% |
| Paraguayans | 24.8 /100 | #198 | Fair 95.9% |
| Guamanians/Chamorros | 23.5 /100 | #199 | Fair 95.9% |
Demographics Similar to Natives/Alaskans by 7th Grade
In terms of 7th grade, the demographic groups most similar to Natives/Alaskans are Senegalese (95.6%, a difference of 0.010%), Immigrants from Panama (95.6%, a difference of 0.020%), Immigrants from Eastern Africa (95.6%, a difference of 0.030%), Immigrants from Western Asia (95.6%, a difference of 0.040%), and Costa Rican (95.5%, a difference of 0.040%).
| Demographics | Rating | Rank | 7th Grade |
| Immigrants | Syria | 6.7 /100 | #223 | Tragic 95.7% |
| Immigrants | Oceania | 6.7 /100 | #224 | Tragic 95.7% |
| Immigrants | Malaysia | 6.2 /100 | #225 | Tragic 95.6% |
| Immigrants | Eastern Asia | 5.8 /100 | #226 | Tragic 95.6% |
| Immigrants | Western Asia | 5.4 /100 | #227 | Tragic 95.6% |
| Immigrants | Eastern Africa | 5.1 /100 | #228 | Tragic 95.6% |
| Immigrants | Panama | 4.9 /100 | #229 | Tragic 95.6% |
| Natives/Alaskans | 4.2 /100 | #230 | Tragic 95.6% |
| Senegalese | 4.0 /100 | #231 | Tragic 95.6% |
| Costa Ricans | 3.3 /100 | #232 | Tragic 95.5% |
| Immigrants | Indonesia | 3.3 /100 | #233 | Tragic 95.5% |
| Nigerians | 3.0 /100 | #234 | Tragic 95.5% |
| Immigrants | Africa | 2.7 /100 | #235 | Tragic 95.5% |
| Asians | 2.6 /100 | #236 | Tragic 95.5% |
| Immigrants | Asia | 2.3 /100 | #237 | Tragic 95.5% |