Mongolian vs Immigrants from Switzerland 7th Grade
COMPARE
Mongolian
Immigrants from Switzerland
7th Grade
7th Grade Comparison
Mongolians
Immigrants from Switzerland
96.0%
7TH GRADE
50.0/ 100
METRIC RATING
174th/ 347
METRIC RANK
96.5%
7TH GRADE
94.5/ 100
METRIC RATING
124th/ 347
METRIC RANK
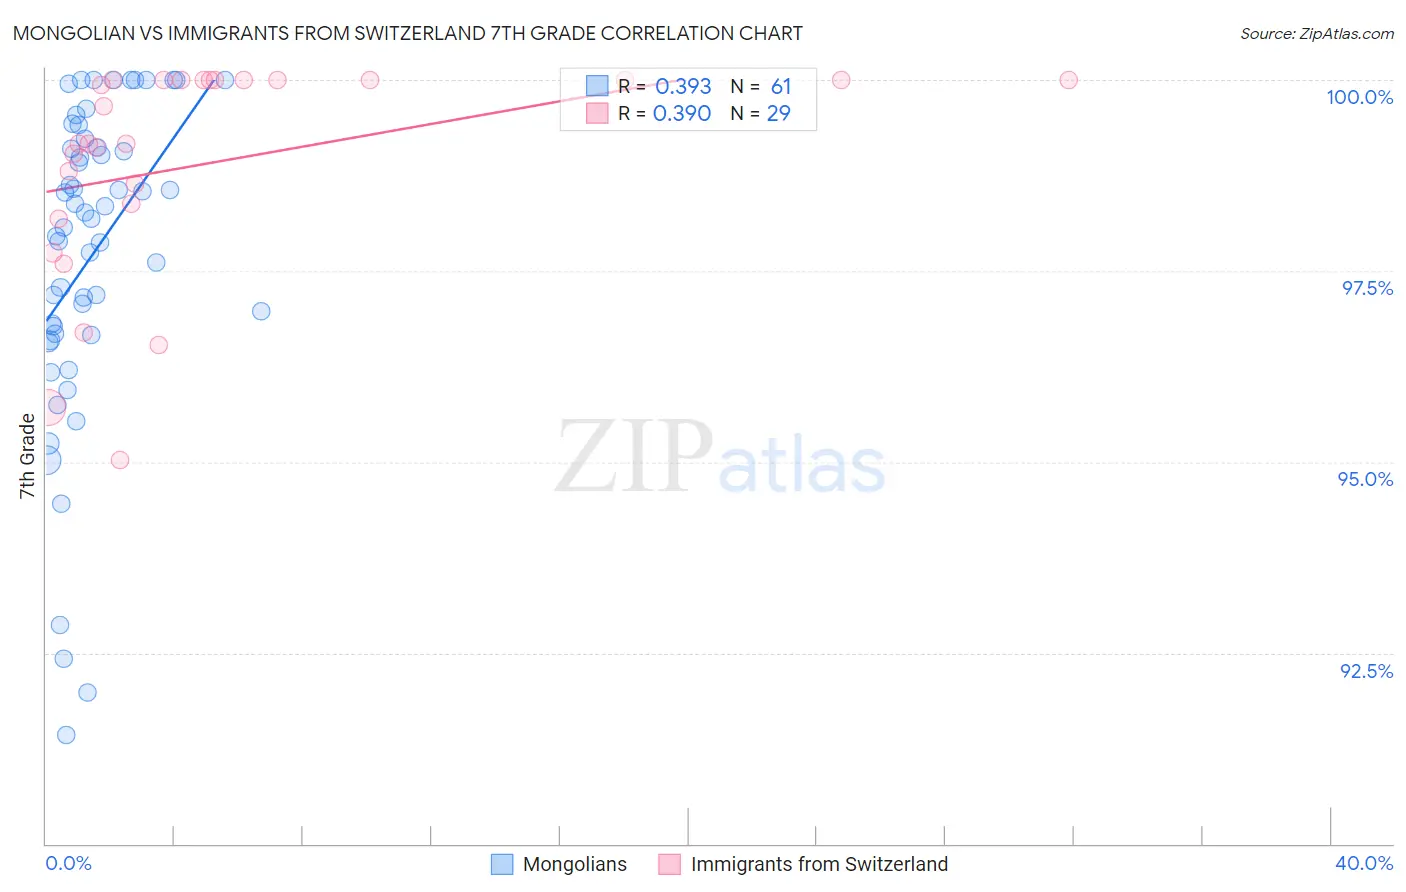
Mongolian vs Immigrants from Switzerland 7th Grade Correlation Chart
The statistical analysis conducted on geographies consisting of 140,362,004 people shows a mild positive correlation between the proportion of Mongolians and percentage of population with at least 7th grade education in the United States with a correlation coefficient (R) of 0.393 and weighted average of 96.0%. Similarly, the statistical analysis conducted on geographies consisting of 148,082,451 people shows a mild positive correlation between the proportion of Immigrants from Switzerland and percentage of population with at least 7th grade education in the United States with a correlation coefficient (R) of 0.390 and weighted average of 96.5%, a difference of 0.44%.
7th Grade Correlation Summary
| Measurement | Mongolian | Immigrants from Switzerland |
| Minimum | 91.4% | 95.0% |
| Maximum | 100.0% | 100.0% |
| Range | 8.6% | 5.0% |
| Mean | 97.7% | 98.9% |
| Median | 98.2% | 99.2% |
| Interquartile 25% (IQ1) | 96.7% | 98.3% |
| Interquartile 75% (IQ3) | 99.2% | 100.0% |
| Interquartile Range (IQR) | 2.5% | 1.7% |
| Standard Deviation (Sample) | 2.1% | 1.4% |
| Standard Deviation (Population) | 2.0% | 1.4% |
Similar Demographics by 7th Grade
Demographics Similar to Mongolians by 7th Grade
In terms of 7th grade, the demographic groups most similar to Mongolians are Immigrants from Albania (96.0%, a difference of 0.0%), Black/African American (96.0%, a difference of 0.0%), Chilean (96.0%, a difference of 0.0%), Venezuelan (96.0%, a difference of 0.010%), and Immigrants from Korea (96.0%, a difference of 0.010%).
| Demographics | Rating | Rank | 7th Grade |
| Immigrants | Sri Lanka | 59.9 /100 | #167 | Average 96.1% |
| Immigrants | Poland | 59.0 /100 | #168 | Average 96.1% |
| Ute | 55.8 /100 | #169 | Average 96.1% |
| Immigrants | Ukraine | 55.0 /100 | #170 | Average 96.1% |
| Egyptians | 54.2 /100 | #171 | Average 96.1% |
| Venezuelans | 51.4 /100 | #172 | Average 96.0% |
| Immigrants | Albania | 50.4 /100 | #173 | Average 96.0% |
| Mongolians | 50.0 /100 | #174 | Average 96.0% |
| Blacks/African Americans | 49.5 /100 | #175 | Average 96.0% |
| Chileans | 49.3 /100 | #176 | Average 96.0% |
| Immigrants | Korea | 49.2 /100 | #177 | Average 96.0% |
| Marshallese | 48.4 /100 | #178 | Average 96.0% |
| Immigrants | Iran | 47.8 /100 | #179 | Average 96.0% |
| Immigrants | Brazil | 46.8 /100 | #180 | Average 96.0% |
| Pakistanis | 44.5 /100 | #181 | Average 96.0% |
Demographics Similar to Immigrants from Switzerland by 7th Grade
In terms of 7th grade, the demographic groups most similar to Immigrants from Switzerland are Cheyenne (96.5%, a difference of 0.010%), Immigrants from Europe (96.5%, a difference of 0.010%), Immigrants from France (96.5%, a difference of 0.010%), Immigrants from Bulgaria (96.4%, a difference of 0.010%), and Immigrants from Norway (96.5%, a difference of 0.020%).
| Demographics | Rating | Rank | 7th Grade |
| Immigrants | Moldova | 95.7 /100 | #117 | Exceptional 96.5% |
| Immigrants | Japan | 95.5 /100 | #118 | Exceptional 96.5% |
| Immigrants | Norway | 95.2 /100 | #119 | Exceptional 96.5% |
| Immigrants | Croatia | 95.0 /100 | #120 | Exceptional 96.5% |
| Cheyenne | 94.9 /100 | #121 | Exceptional 96.5% |
| Immigrants | Europe | 94.8 /100 | #122 | Exceptional 96.5% |
| Immigrants | France | 94.7 /100 | #123 | Exceptional 96.5% |
| Immigrants | Switzerland | 94.5 /100 | #124 | Exceptional 96.5% |
| Immigrants | Bulgaria | 94.0 /100 | #125 | Exceptional 96.4% |
| Palestinians | 93.5 /100 | #126 | Exceptional 96.4% |
| Immigrants | Bosnia and Herzegovina | 93.3 /100 | #127 | Exceptional 96.4% |
| Immigrants | Romania | 93.2 /100 | #128 | Exceptional 96.4% |
| Immigrants | North Macedonia | 93.1 /100 | #129 | Exceptional 96.4% |
| Immigrants | Serbia | 92.8 /100 | #130 | Exceptional 96.4% |
| Filipinos | 92.1 /100 | #131 | Exceptional 96.4% |