Immigrants from Sweden vs Immigrants from Germany Associate's Degree
COMPARE
Immigrants from Sweden
Immigrants from Germany
Associate's Degree
Associate's Degree Comparison
Immigrants from Sweden
Immigrants from Germany
54.6%
ASSOCIATE'S DEGREE
100.0/ 100
METRIC RATING
21st/ 347
METRIC RANK
47.1%
ASSOCIATE'S DEGREE
69.7/ 100
METRIC RATING
158th/ 347
METRIC RANK
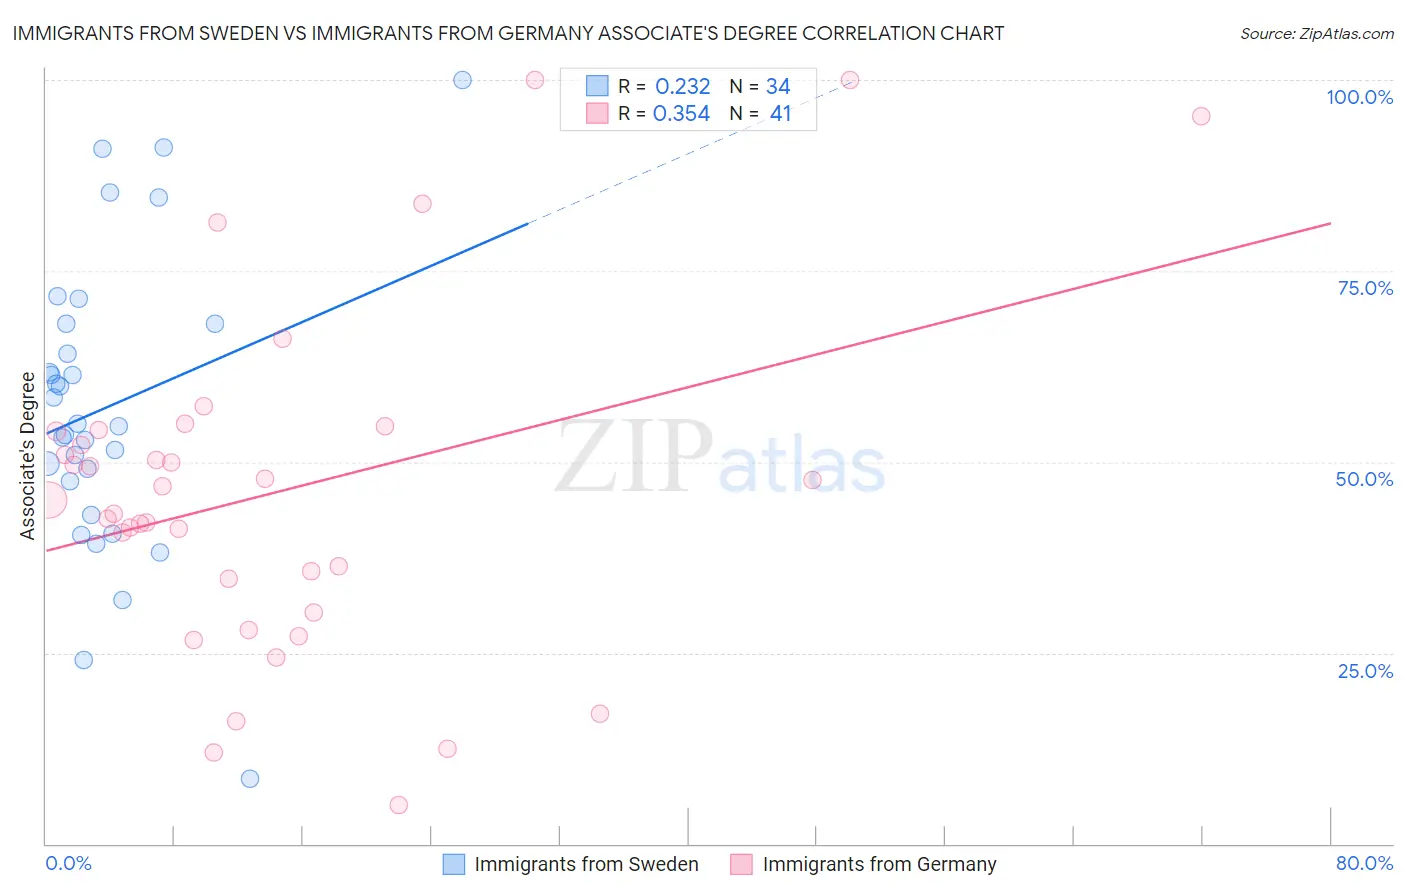
Immigrants from Sweden vs Immigrants from Germany Associate's Degree Correlation Chart
The statistical analysis conducted on geographies consisting of 164,727,727 people shows a weak positive correlation between the proportion of Immigrants from Sweden and percentage of population with at least associate's degree education in the United States with a correlation coefficient (R) of 0.232 and weighted average of 54.6%. Similarly, the statistical analysis conducted on geographies consisting of 463,874,369 people shows a mild positive correlation between the proportion of Immigrants from Germany and percentage of population with at least associate's degree education in the United States with a correlation coefficient (R) of 0.354 and weighted average of 47.1%, a difference of 16.0%.
Associate's Degree Correlation Summary
| Measurement | Immigrants from Sweden | Immigrants from Germany |
| Minimum | 8.6% | 5.1% |
| Maximum | 100.0% | 100.0% |
| Range | 91.4% | 94.9% |
| Mean | 57.1% | 46.1% |
| Median | 54.8% | 44.9% |
| Interquartile 25% (IQ1) | 47.4% | 32.5% |
| Interquartile 75% (IQ3) | 68.1% | 54.1% |
| Interquartile Range (IQR) | 20.7% | 21.6% |
| Standard Deviation (Sample) | 19.3% | 22.2% |
| Standard Deviation (Population) | 19.0% | 22.0% |
Similar Demographics by Associate's Degree
Demographics Similar to Immigrants from Sweden by Associate's Degree
In terms of associate's degree, the demographic groups most similar to Immigrants from Sweden are Immigrants from Japan (54.6%, a difference of 0.030%), Burmese (54.6%, a difference of 0.030%), Cambodian (54.6%, a difference of 0.060%), Immigrants from Ireland (54.7%, a difference of 0.090%), and Immigrants from Korea (54.5%, a difference of 0.12%).
| Demographics | Rating | Rank | Associate's Degree |
| Immigrants | Hong Kong | 100.0 /100 | #14 | Exceptional 55.4% |
| Immigrants | Eastern Asia | 100.0 /100 | #15 | Exceptional 55.4% |
| Soviet Union | 100.0 /100 | #16 | Exceptional 55.1% |
| Eastern Europeans | 100.0 /100 | #17 | Exceptional 55.0% |
| Indians (Asian) | 100.0 /100 | #18 | Exceptional 54.8% |
| Immigrants | Ireland | 100.0 /100 | #19 | Exceptional 54.7% |
| Cambodians | 100.0 /100 | #20 | Exceptional 54.6% |
| Immigrants | Sweden | 100.0 /100 | #21 | Exceptional 54.6% |
| Immigrants | Japan | 100.0 /100 | #22 | Exceptional 54.6% |
| Burmese | 100.0 /100 | #23 | Exceptional 54.6% |
| Immigrants | Korea | 100.0 /100 | #24 | Exceptional 54.5% |
| Immigrants | Switzerland | 100.0 /100 | #25 | Exceptional 54.5% |
| Immigrants | Belgium | 100.0 /100 | #26 | Exceptional 54.5% |
| Latvians | 100.0 /100 | #27 | Exceptional 53.9% |
| Turks | 100.0 /100 | #28 | Exceptional 53.9% |
Demographics Similar to Immigrants from Germany by Associate's Degree
In terms of associate's degree, the demographic groups most similar to Immigrants from Germany are Sudanese (47.1%, a difference of 0.040%), Immigrants from Poland (47.1%, a difference of 0.050%), South American (47.1%, a difference of 0.070%), Kenyan (47.1%, a difference of 0.080%), and Immigrants from Kenya (47.2%, a difference of 0.21%).
| Demographics | Rating | Rank | Associate's Degree |
| Immigrants | North Macedonia | 76.0 /100 | #151 | Good 47.4% |
| Immigrants | Afghanistan | 74.3 /100 | #152 | Good 47.3% |
| Czechs | 72.2 /100 | #153 | Good 47.2% |
| Immigrants | Kenya | 72.1 /100 | #154 | Good 47.2% |
| Kenyans | 70.6 /100 | #155 | Good 47.1% |
| South Americans | 70.5 /100 | #156 | Good 47.1% |
| Sudanese | 70.3 /100 | #157 | Good 47.1% |
| Immigrants | Germany | 69.7 /100 | #158 | Good 47.1% |
| Immigrants | Poland | 69.2 /100 | #159 | Good 47.1% |
| Scottish | 65.4 /100 | #160 | Good 46.9% |
| Scandinavians | 65.2 /100 | #161 | Good 46.9% |
| Immigrants | Africa | 63.2 /100 | #162 | Good 46.8% |
| Somalis | 62.5 /100 | #163 | Good 46.8% |
| Colombians | 62.4 /100 | #164 | Good 46.8% |
| Immigrants | South America | 59.9 /100 | #165 | Average 46.7% |