Panamanian vs Immigrants from Eastern Asia 5th Grade
COMPARE
Panamanian
Immigrants from Eastern Asia
5th Grade
5th Grade Comparison
Panamanians
Immigrants from Eastern Asia
97.3%
5TH GRADE
31.3/ 100
METRIC RATING
192nd/ 347
METRIC RANK
97.0%
5TH GRADE
4.0/ 100
METRIC RATING
232nd/ 347
METRIC RANK
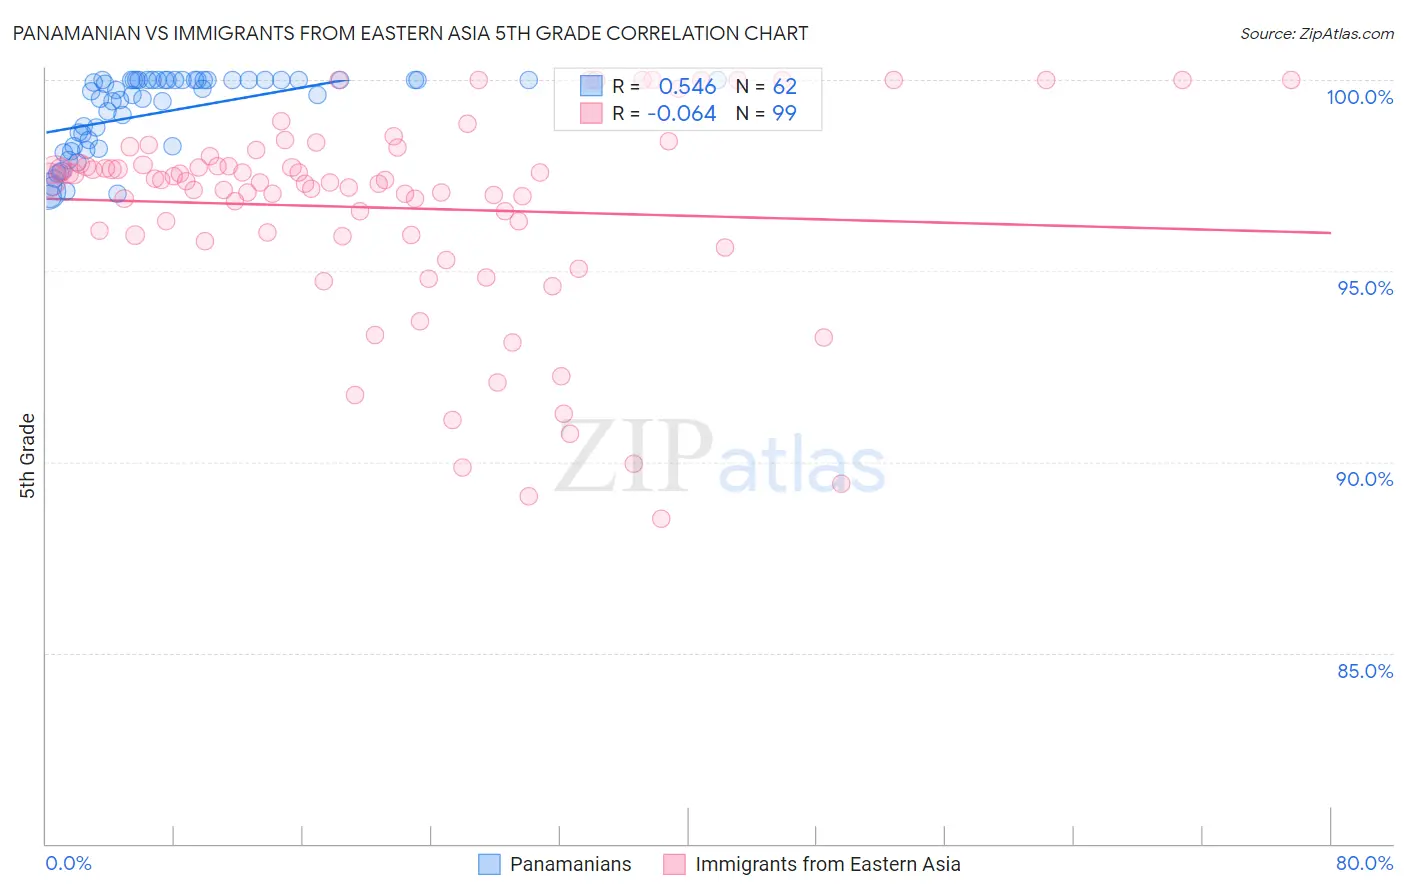
Panamanian vs Immigrants from Eastern Asia 5th Grade Correlation Chart
The statistical analysis conducted on geographies consisting of 281,248,945 people shows a substantial positive correlation between the proportion of Panamanians and percentage of population with at least 5th grade education in the United States with a correlation coefficient (R) of 0.546 and weighted average of 97.3%. Similarly, the statistical analysis conducted on geographies consisting of 499,865,893 people shows a slight negative correlation between the proportion of Immigrants from Eastern Asia and percentage of population with at least 5th grade education in the United States with a correlation coefficient (R) of -0.064 and weighted average of 97.0%, a difference of 0.25%.
5th Grade Correlation Summary
| Measurement | Panamanian | Immigrants from Eastern Asia |
| Minimum | 97.0% | 88.5% |
| Maximum | 100.0% | 100.0% |
| Range | 3.0% | 11.5% |
| Mean | 99.2% | 96.6% |
| Median | 99.6% | 97.4% |
| Interquartile 25% (IQ1) | 98.3% | 95.9% |
| Interquartile 75% (IQ3) | 100.0% | 98.0% |
| Interquartile Range (IQR) | 1.7% | 2.1% |
| Standard Deviation (Sample) | 1.0% | 2.7% |
| Standard Deviation (Population) | 1.0% | 2.7% |
Similar Demographics by 5th Grade
Demographics Similar to Panamanians by 5th Grade
In terms of 5th grade, the demographic groups most similar to Panamanians are Black/African American (97.3%, a difference of 0.0%), Immigrants from Brazil (97.3%, a difference of 0.0%), Paraguayan (97.3%, a difference of 0.010%), Immigrants from Egypt (97.3%, a difference of 0.010%), and Navajo (97.2%, a difference of 0.010%).
| Demographics | Rating | Rank | 5th Grade |
| Dutch West Indians | 36.2 /100 | #185 | Fair 97.3% |
| Immigrants | Argentina | 36.1 /100 | #186 | Fair 97.3% |
| Spanish Americans | 34.7 /100 | #187 | Fair 97.3% |
| Paraguayans | 33.7 /100 | #188 | Fair 97.3% |
| Immigrants | Egypt | 32.9 /100 | #189 | Fair 97.3% |
| Blacks/African Americans | 31.8 /100 | #190 | Fair 97.3% |
| Immigrants | Brazil | 31.5 /100 | #191 | Fair 97.3% |
| Panamanians | 31.3 /100 | #192 | Fair 97.3% |
| Navajo | 29.0 /100 | #193 | Fair 97.2% |
| Immigrants | Albania | 28.5 /100 | #194 | Fair 97.2% |
| Guamanians/Chamorros | 26.8 /100 | #195 | Fair 97.2% |
| Hawaiians | 25.6 /100 | #196 | Fair 97.2% |
| Brazilians | 25.4 /100 | #197 | Fair 97.2% |
| Immigrants | Uganda | 21.1 /100 | #198 | Fair 97.2% |
| Natives/Alaskans | 18.0 /100 | #199 | Poor 97.2% |
Demographics Similar to Immigrants from Eastern Asia by 5th Grade
In terms of 5th grade, the demographic groups most similar to Immigrants from Eastern Asia are Immigrants from Malaysia (97.0%, a difference of 0.0%), Assyrian/Chaldean/Syriac (97.0%, a difference of 0.010%), Yuman (97.0%, a difference of 0.010%), Immigrants from Western Asia (97.0%, a difference of 0.010%), and Immigrants from Pakistan (97.0%, a difference of 0.020%).
| Demographics | Rating | Rank | 5th Grade |
| Bahamians | 5.3 /100 | #225 | Tragic 97.0% |
| Tongans | 5.3 /100 | #226 | Tragic 97.0% |
| Immigrants | Pakistan | 4.7 /100 | #227 | Tragic 97.0% |
| Assyrians/Chaldeans/Syriacs | 4.5 /100 | #228 | Tragic 97.0% |
| Yuman | 4.5 /100 | #229 | Tragic 97.0% |
| Immigrants | Western Asia | 4.3 /100 | #230 | Tragic 97.0% |
| Immigrants | Malaysia | 4.1 /100 | #231 | Tragic 97.0% |
| Immigrants | Eastern Asia | 4.0 /100 | #232 | Tragic 97.0% |
| Sub-Saharan Africans | 3.3 /100 | #233 | Tragic 97.0% |
| Tohono O'odham | 3.2 /100 | #234 | Tragic 97.0% |
| Uruguayans | 3.2 /100 | #235 | Tragic 97.0% |
| Senegalese | 2.8 /100 | #236 | Tragic 97.0% |
| Immigrants | Indonesia | 2.0 /100 | #237 | Tragic 96.9% |
| Asians | 2.0 /100 | #238 | Tragic 96.9% |
| Nigerians | 1.9 /100 | #239 | Tragic 96.9% |