Panamanian vs West Indian 5th Grade
COMPARE
Panamanian
West Indian
5th Grade
5th Grade Comparison
Panamanians
West Indians
97.3%
5TH GRADE
31.3/ 100
METRIC RATING
192nd/ 347
METRIC RANK
96.8%
5TH GRADE
0.3/ 100
METRIC RATING
264th/ 347
METRIC RANK
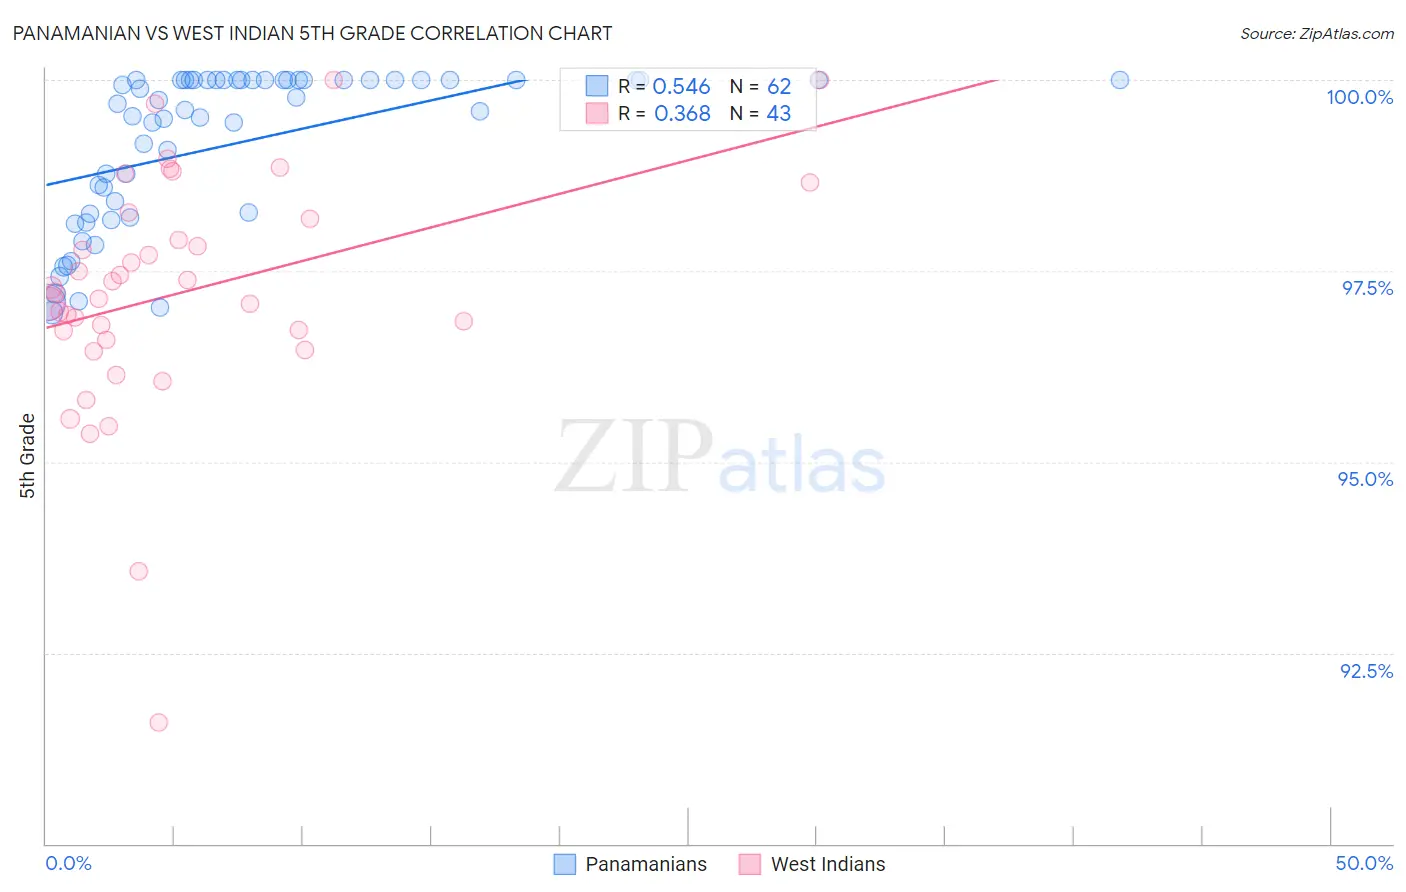
Panamanian vs West Indian 5th Grade Correlation Chart
The statistical analysis conducted on geographies consisting of 281,248,945 people shows a substantial positive correlation between the proportion of Panamanians and percentage of population with at least 5th grade education in the United States with a correlation coefficient (R) of 0.546 and weighted average of 97.3%. Similarly, the statistical analysis conducted on geographies consisting of 254,059,006 people shows a mild positive correlation between the proportion of West Indians and percentage of population with at least 5th grade education in the United States with a correlation coefficient (R) of 0.368 and weighted average of 96.8%, a difference of 0.52%.
5th Grade Correlation Summary
| Measurement | Panamanian | West Indian |
| Minimum | 97.0% | 91.6% |
| Maximum | 100.0% | 100.0% |
| Range | 3.0% | 8.4% |
| Mean | 99.2% | 97.2% |
| Median | 99.6% | 97.2% |
| Interquartile 25% (IQ1) | 98.3% | 96.6% |
| Interquartile 75% (IQ3) | 100.0% | 98.2% |
| Interquartile Range (IQR) | 1.7% | 1.6% |
| Standard Deviation (Sample) | 1.0% | 1.6% |
| Standard Deviation (Population) | 1.0% | 1.5% |
Similar Demographics by 5th Grade
Demographics Similar to Panamanians by 5th Grade
In terms of 5th grade, the demographic groups most similar to Panamanians are Black/African American (97.3%, a difference of 0.0%), Immigrants from Brazil (97.3%, a difference of 0.0%), Paraguayan (97.3%, a difference of 0.010%), Immigrants from Egypt (97.3%, a difference of 0.010%), and Navajo (97.2%, a difference of 0.010%).
| Demographics | Rating | Rank | 5th Grade |
| Dutch West Indians | 36.2 /100 | #185 | Fair 97.3% |
| Immigrants | Argentina | 36.1 /100 | #186 | Fair 97.3% |
| Spanish Americans | 34.7 /100 | #187 | Fair 97.3% |
| Paraguayans | 33.7 /100 | #188 | Fair 97.3% |
| Immigrants | Egypt | 32.9 /100 | #189 | Fair 97.3% |
| Blacks/African Americans | 31.8 /100 | #190 | Fair 97.3% |
| Immigrants | Brazil | 31.5 /100 | #191 | Fair 97.3% |
| Panamanians | 31.3 /100 | #192 | Fair 97.3% |
| Navajo | 29.0 /100 | #193 | Fair 97.2% |
| Immigrants | Albania | 28.5 /100 | #194 | Fair 97.2% |
| Guamanians/Chamorros | 26.8 /100 | #195 | Fair 97.2% |
| Hawaiians | 25.6 /100 | #196 | Fair 97.2% |
| Brazilians | 25.4 /100 | #197 | Fair 97.2% |
| Immigrants | Uganda | 21.1 /100 | #198 | Fair 97.2% |
| Natives/Alaskans | 18.0 /100 | #199 | Poor 97.2% |
Demographics Similar to West Indians by 5th Grade
In terms of 5th grade, the demographic groups most similar to West Indians are Taiwanese (96.7%, a difference of 0.0%), Immigrants from Colombia (96.8%, a difference of 0.010%), Immigrants from Uzbekistan (96.8%, a difference of 0.010%), Immigrants from Nigeria (96.7%, a difference of 0.010%), and Immigrants from South America (96.7%, a difference of 0.010%).
| Demographics | Rating | Rank | 5th Grade |
| Peruvians | 0.6 /100 | #257 | Tragic 96.8% |
| Immigrants | Ethiopia | 0.5 /100 | #258 | Tragic 96.8% |
| Immigrants | China | 0.5 /100 | #259 | Tragic 96.8% |
| Immigrants | Jamaica | 0.4 /100 | #260 | Tragic 96.8% |
| Immigrants | Sierra Leone | 0.4 /100 | #261 | Tragic 96.8% |
| Immigrants | Colombia | 0.4 /100 | #262 | Tragic 96.8% |
| Immigrants | Uzbekistan | 0.3 /100 | #263 | Tragic 96.8% |
| West Indians | 0.3 /100 | #264 | Tragic 96.8% |
| Taiwanese | 0.3 /100 | #265 | Tragic 96.7% |
| Immigrants | Nigeria | 0.3 /100 | #266 | Tragic 96.7% |
| Immigrants | South America | 0.3 /100 | #267 | Tragic 96.7% |
| Armenians | 0.3 /100 | #268 | Tragic 96.7% |
| Ghanaians | 0.2 /100 | #269 | Tragic 96.7% |
| Afghans | 0.2 /100 | #270 | Tragic 96.7% |
| Immigrants | Hong Kong | 0.2 /100 | #271 | Tragic 96.7% |