Houma vs Immigrants from Eastern Asia 5th Grade
COMPARE
Houma
Immigrants from Eastern Asia
5th Grade
5th Grade Comparison
Houma
Immigrants from Eastern Asia
96.6%
5TH GRADE
0.1/ 100
METRIC RATING
281st/ 347
METRIC RANK
97.0%
5TH GRADE
4.0/ 100
METRIC RATING
232nd/ 347
METRIC RANK
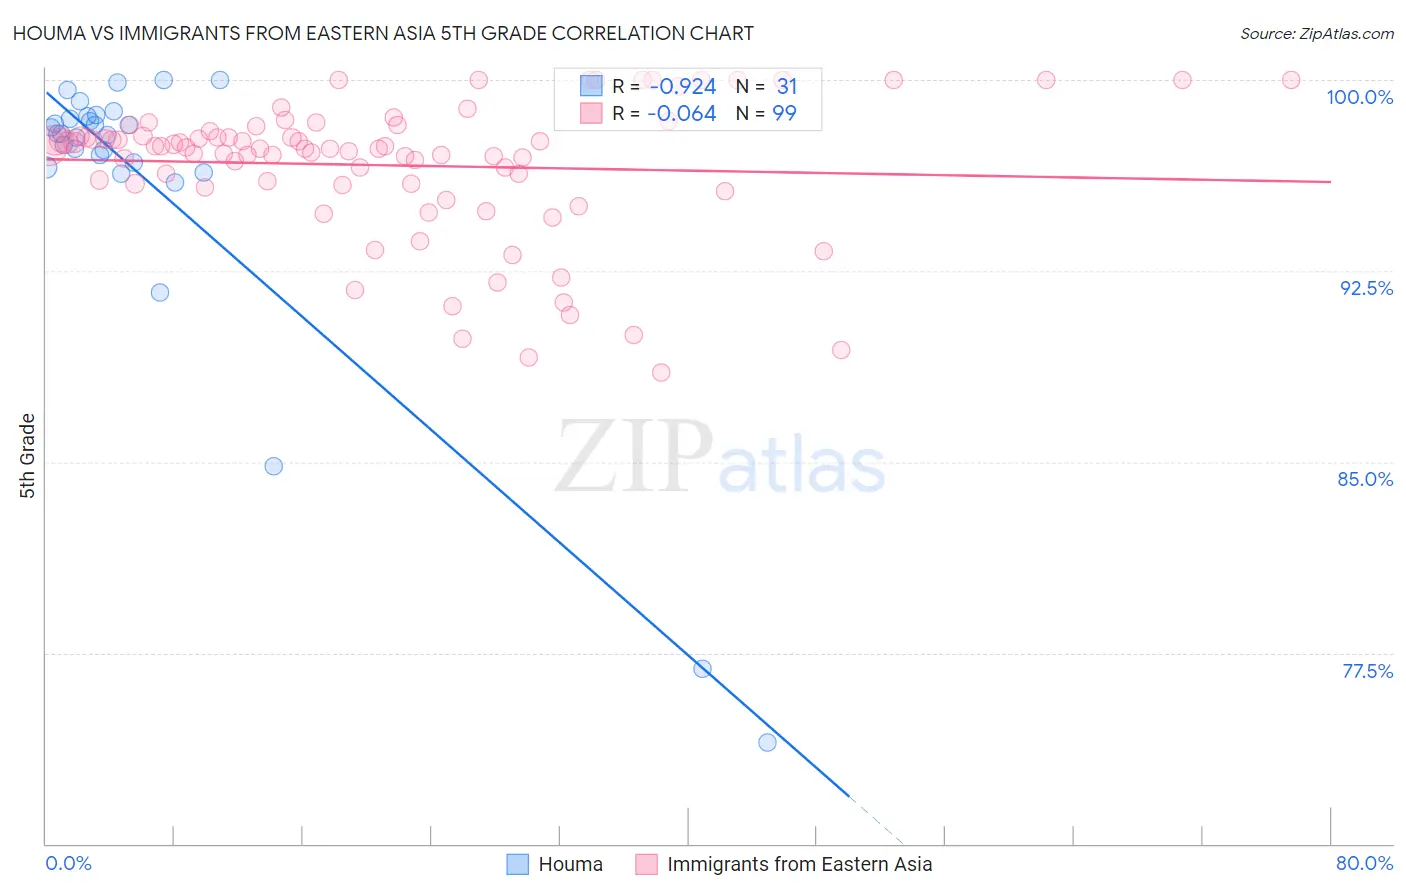
Houma vs Immigrants from Eastern Asia 5th Grade Correlation Chart
The statistical analysis conducted on geographies consisting of 36,795,916 people shows a near-perfect negative correlation between the proportion of Houma and percentage of population with at least 5th grade education in the United States with a correlation coefficient (R) of -0.924 and weighted average of 96.6%. Similarly, the statistical analysis conducted on geographies consisting of 499,865,893 people shows a slight negative correlation between the proportion of Immigrants from Eastern Asia and percentage of population with at least 5th grade education in the United States with a correlation coefficient (R) of -0.064 and weighted average of 97.0%, a difference of 0.41%.
5th Grade Correlation Summary
| Measurement | Houma | Immigrants from Eastern Asia |
| Minimum | 74.0% | 88.5% |
| Maximum | 100.0% | 100.0% |
| Range | 26.0% | 11.5% |
| Mean | 95.9% | 96.6% |
| Median | 97.9% | 97.4% |
| Interquartile 25% (IQ1) | 96.6% | 95.9% |
| Interquartile 75% (IQ3) | 98.6% | 98.0% |
| Interquartile Range (IQR) | 2.0% | 2.1% |
| Standard Deviation (Sample) | 6.2% | 2.7% |
| Standard Deviation (Population) | 6.1% | 2.7% |
Similar Demographics by 5th Grade
Demographics Similar to Houma by 5th Grade
In terms of 5th grade, the demographic groups most similar to Houma are Immigrants from Western Africa (96.6%, a difference of 0.0%), Barbadian (96.6%, a difference of 0.0%), Fijian (96.6%, a difference of 0.0%), Immigrants from Philippines (96.6%, a difference of 0.010%), and Immigrants from Trinidad and Tobago (96.6%, a difference of 0.010%).
| Demographics | Rating | Rank | 5th Grade |
| Immigrants | Cameroon | 0.1 /100 | #274 | Tragic 96.7% |
| Immigrants | Peru | 0.1 /100 | #275 | Tragic 96.6% |
| Cubans | 0.1 /100 | #276 | Tragic 96.6% |
| Immigrants | Bolivia | 0.1 /100 | #277 | Tragic 96.6% |
| Immigrants | Ghana | 0.1 /100 | #278 | Tragic 96.6% |
| Immigrants | Philippines | 0.1 /100 | #279 | Tragic 96.6% |
| Immigrants | Western Africa | 0.1 /100 | #280 | Tragic 96.6% |
| Houma | 0.1 /100 | #281 | Tragic 96.6% |
| Barbadians | 0.1 /100 | #282 | Tragic 96.6% |
| Fijians | 0.1 /100 | #283 | Tragic 96.6% |
| Immigrants | Trinidad and Tobago | 0.1 /100 | #284 | Tragic 96.6% |
| Immigrants | St. Vincent and the Grenadines | 0.1 /100 | #285 | Tragic 96.6% |
| Immigrants | Thailand | 0.1 /100 | #286 | Tragic 96.6% |
| Immigrants | Afghanistan | 0.1 /100 | #287 | Tragic 96.6% |
| Immigrants | Barbados | 0.0 /100 | #288 | Tragic 96.6% |
Demographics Similar to Immigrants from Eastern Asia by 5th Grade
In terms of 5th grade, the demographic groups most similar to Immigrants from Eastern Asia are Immigrants from Malaysia (97.0%, a difference of 0.0%), Assyrian/Chaldean/Syriac (97.0%, a difference of 0.010%), Yuman (97.0%, a difference of 0.010%), Immigrants from Western Asia (97.0%, a difference of 0.010%), and Immigrants from Pakistan (97.0%, a difference of 0.020%).
| Demographics | Rating | Rank | 5th Grade |
| Bahamians | 5.3 /100 | #225 | Tragic 97.0% |
| Tongans | 5.3 /100 | #226 | Tragic 97.0% |
| Immigrants | Pakistan | 4.7 /100 | #227 | Tragic 97.0% |
| Assyrians/Chaldeans/Syriacs | 4.5 /100 | #228 | Tragic 97.0% |
| Yuman | 4.5 /100 | #229 | Tragic 97.0% |
| Immigrants | Western Asia | 4.3 /100 | #230 | Tragic 97.0% |
| Immigrants | Malaysia | 4.1 /100 | #231 | Tragic 97.0% |
| Immigrants | Eastern Asia | 4.0 /100 | #232 | Tragic 97.0% |
| Sub-Saharan Africans | 3.3 /100 | #233 | Tragic 97.0% |
| Tohono O'odham | 3.2 /100 | #234 | Tragic 97.0% |
| Uruguayans | 3.2 /100 | #235 | Tragic 97.0% |
| Senegalese | 2.8 /100 | #236 | Tragic 97.0% |
| Immigrants | Indonesia | 2.0 /100 | #237 | Tragic 96.9% |
| Asians | 2.0 /100 | #238 | Tragic 96.9% |
| Nigerians | 1.9 /100 | #239 | Tragic 96.9% |