Bangladeshi vs Immigrants from Eastern Asia 5th Grade
COMPARE
Bangladeshi
Immigrants from Eastern Asia
5th Grade
5th Grade Comparison
Bangladeshis
Immigrants from Eastern Asia
95.9%
5TH GRADE
0.0/ 100
METRIC RATING
313th/ 347
METRIC RANK
97.0%
5TH GRADE
4.0/ 100
METRIC RATING
232nd/ 347
METRIC RANK
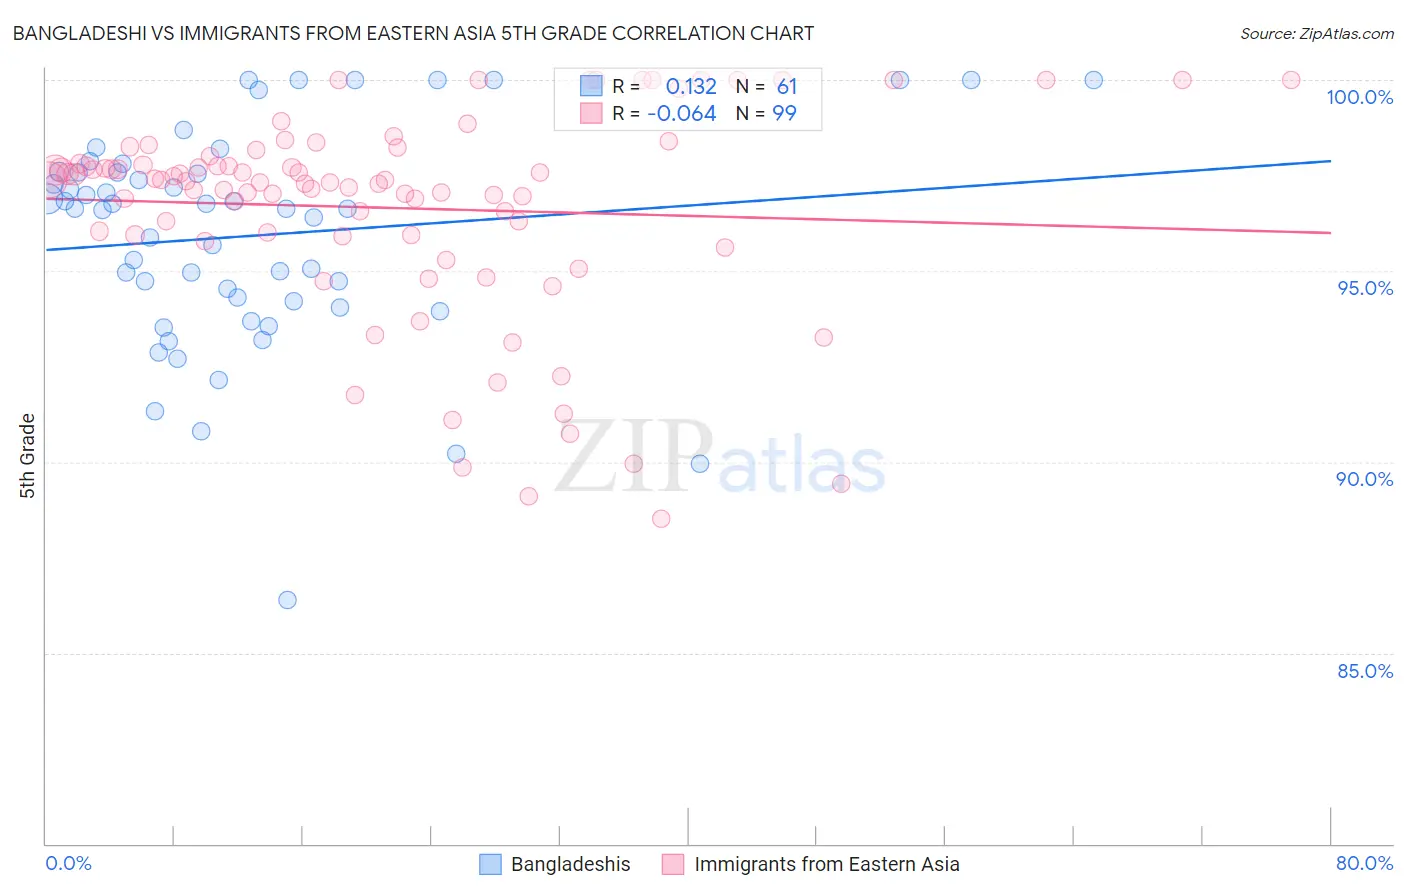
Bangladeshi vs Immigrants from Eastern Asia 5th Grade Correlation Chart
The statistical analysis conducted on geographies consisting of 141,430,495 people shows a poor positive correlation between the proportion of Bangladeshis and percentage of population with at least 5th grade education in the United States with a correlation coefficient (R) of 0.132 and weighted average of 95.9%. Similarly, the statistical analysis conducted on geographies consisting of 499,865,893 people shows a slight negative correlation between the proportion of Immigrants from Eastern Asia and percentage of population with at least 5th grade education in the United States with a correlation coefficient (R) of -0.064 and weighted average of 97.0%, a difference of 1.1%.
5th Grade Correlation Summary
| Measurement | Bangladeshi | Immigrants from Eastern Asia |
| Minimum | 86.4% | 88.5% |
| Maximum | 100.0% | 100.0% |
| Range | 13.6% | 11.5% |
| Mean | 95.9% | 96.6% |
| Median | 96.6% | 97.4% |
| Interquartile 25% (IQ1) | 94.1% | 95.9% |
| Interquartile 75% (IQ3) | 97.6% | 98.0% |
| Interquartile Range (IQR) | 3.5% | 2.1% |
| Standard Deviation (Sample) | 2.9% | 2.7% |
| Standard Deviation (Population) | 2.8% | 2.7% |
Similar Demographics by 5th Grade
Demographics Similar to Bangladeshis by 5th Grade
In terms of 5th grade, the demographic groups most similar to Bangladeshis are Immigrants from Portugal (95.9%, a difference of 0.0%), Vietnamese (95.9%, a difference of 0.020%), Nicaraguan (95.9%, a difference of 0.020%), Immigrants from Bangladesh (96.0%, a difference of 0.050%), and Indonesian (96.0%, a difference of 0.070%).
| Demographics | Rating | Rank | 5th Grade |
| Immigrants | Haiti | 0.0 /100 | #306 | Tragic 96.0% |
| Immigrants | Caribbean | 0.0 /100 | #307 | Tragic 96.0% |
| Ecuadorians | 0.0 /100 | #308 | Tragic 96.0% |
| Immigrants | Guyana | 0.0 /100 | #309 | Tragic 96.0% |
| Indonesians | 0.0 /100 | #310 | Tragic 96.0% |
| Immigrants | Bangladesh | 0.0 /100 | #311 | Tragic 96.0% |
| Vietnamese | 0.0 /100 | #312 | Tragic 95.9% |
| Bangladeshis | 0.0 /100 | #313 | Tragic 95.9% |
| Immigrants | Portugal | 0.0 /100 | #314 | Tragic 95.9% |
| Nicaraguans | 0.0 /100 | #315 | Tragic 95.9% |
| Immigrants | Ecuador | 0.0 /100 | #316 | Tragic 95.8% |
| Belizeans | 0.0 /100 | #317 | Tragic 95.8% |
| Immigrants | Vietnam | 0.0 /100 | #318 | Tragic 95.8% |
| Japanese | 0.0 /100 | #319 | Tragic 95.7% |
| Central American Indians | 0.0 /100 | #320 | Tragic 95.7% |
Demographics Similar to Immigrants from Eastern Asia by 5th Grade
In terms of 5th grade, the demographic groups most similar to Immigrants from Eastern Asia are Immigrants from Malaysia (97.0%, a difference of 0.0%), Assyrian/Chaldean/Syriac (97.0%, a difference of 0.010%), Yuman (97.0%, a difference of 0.010%), Immigrants from Western Asia (97.0%, a difference of 0.010%), and Immigrants from Pakistan (97.0%, a difference of 0.020%).
| Demographics | Rating | Rank | 5th Grade |
| Bahamians | 5.3 /100 | #225 | Tragic 97.0% |
| Tongans | 5.3 /100 | #226 | Tragic 97.0% |
| Immigrants | Pakistan | 4.7 /100 | #227 | Tragic 97.0% |
| Assyrians/Chaldeans/Syriacs | 4.5 /100 | #228 | Tragic 97.0% |
| Yuman | 4.5 /100 | #229 | Tragic 97.0% |
| Immigrants | Western Asia | 4.3 /100 | #230 | Tragic 97.0% |
| Immigrants | Malaysia | 4.1 /100 | #231 | Tragic 97.0% |
| Immigrants | Eastern Asia | 4.0 /100 | #232 | Tragic 97.0% |
| Sub-Saharan Africans | 3.3 /100 | #233 | Tragic 97.0% |
| Tohono O'odham | 3.2 /100 | #234 | Tragic 97.0% |
| Uruguayans | 3.2 /100 | #235 | Tragic 97.0% |
| Senegalese | 2.8 /100 | #236 | Tragic 97.0% |
| Immigrants | Indonesia | 2.0 /100 | #237 | Tragic 96.9% |
| Asians | 2.0 /100 | #238 | Tragic 96.9% |
| Nigerians | 1.9 /100 | #239 | Tragic 96.9% |