Eastern European vs Immigrants from Eastern Asia 5th Grade
COMPARE
Eastern European
Immigrants from Eastern Asia
5th Grade
5th Grade Comparison
Eastern Europeans
Immigrants from Eastern Asia
98.1%
5TH GRADE
99.9/ 100
METRIC RATING
40th/ 347
METRIC RANK
97.0%
5TH GRADE
4.0/ 100
METRIC RATING
232nd/ 347
METRIC RANK
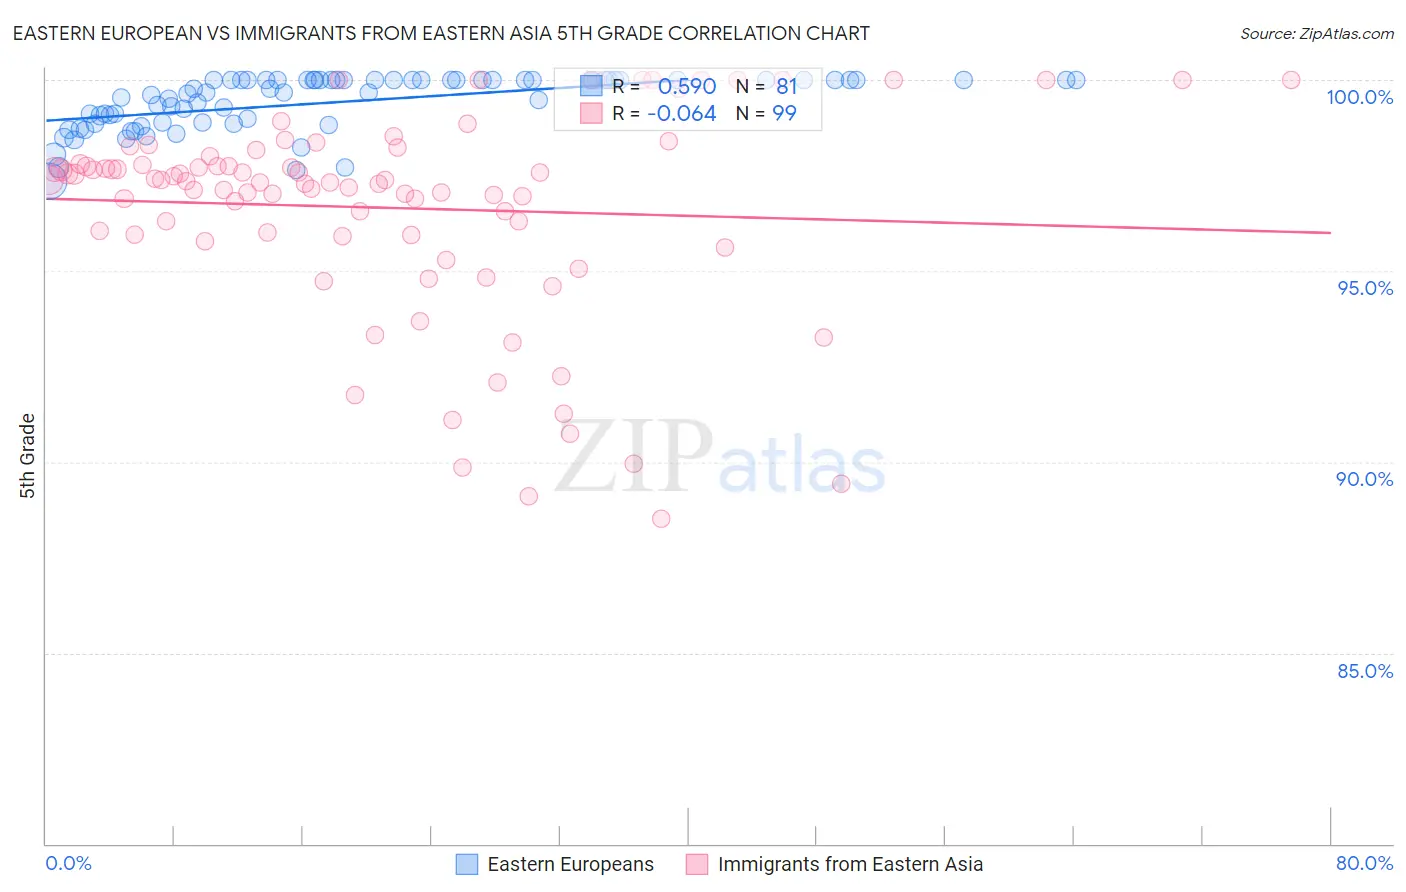
Eastern European vs Immigrants from Eastern Asia 5th Grade Correlation Chart
The statistical analysis conducted on geographies consisting of 461,244,590 people shows a substantial positive correlation between the proportion of Eastern Europeans and percentage of population with at least 5th grade education in the United States with a correlation coefficient (R) of 0.590 and weighted average of 98.1%. Similarly, the statistical analysis conducted on geographies consisting of 499,865,893 people shows a slight negative correlation between the proportion of Immigrants from Eastern Asia and percentage of population with at least 5th grade education in the United States with a correlation coefficient (R) of -0.064 and weighted average of 97.0%, a difference of 1.1%.
5th Grade Correlation Summary
| Measurement | Eastern European | Immigrants from Eastern Asia |
| Minimum | 97.3% | 88.5% |
| Maximum | 100.0% | 100.0% |
| Range | 2.7% | 11.5% |
| Mean | 99.4% | 96.6% |
| Median | 99.7% | 97.4% |
| Interquartile 25% (IQ1) | 98.9% | 95.9% |
| Interquartile 75% (IQ3) | 100.0% | 98.0% |
| Interquartile Range (IQR) | 1.1% | 2.1% |
| Standard Deviation (Sample) | 0.70% | 2.7% |
| Standard Deviation (Population) | 0.70% | 2.7% |
Similar Demographics by 5th Grade
Demographics Similar to Eastern Europeans by 5th Grade
In terms of 5th grade, the demographic groups most similar to Eastern Europeans are Belgian (98.1%, a difference of 0.010%), Luxembourger (98.1%, a difference of 0.010%), Latvian (98.1%, a difference of 0.020%), Hungarian (98.0%, a difference of 0.020%), and Northern European (98.0%, a difference of 0.030%).
| Demographics | Rating | Rank | 5th Grade |
| Swiss | 100.0 /100 | #33 | Exceptional 98.1% |
| Chinese | 100.0 /100 | #34 | Exceptional 98.1% |
| Italians | 100.0 /100 | #35 | Exceptional 98.1% |
| British | 100.0 /100 | #36 | Exceptional 98.1% |
| Latvians | 99.9 /100 | #37 | Exceptional 98.1% |
| Belgians | 99.9 /100 | #38 | Exceptional 98.1% |
| Luxembourgers | 99.9 /100 | #39 | Exceptional 98.1% |
| Eastern Europeans | 99.9 /100 | #40 | Exceptional 98.1% |
| Hungarians | 99.9 /100 | #41 | Exceptional 98.0% |
| Northern Europeans | 99.9 /100 | #42 | Exceptional 98.0% |
| Ottawa | 99.9 /100 | #43 | Exceptional 98.0% |
| Aleuts | 99.9 /100 | #44 | Exceptional 98.0% |
| Czechoslovakians | 99.9 /100 | #45 | Exceptional 98.0% |
| Arapaho | 99.9 /100 | #46 | Exceptional 98.0% |
| Native Hawaiians | 99.9 /100 | #47 | Exceptional 98.0% |
Demographics Similar to Immigrants from Eastern Asia by 5th Grade
In terms of 5th grade, the demographic groups most similar to Immigrants from Eastern Asia are Immigrants from Malaysia (97.0%, a difference of 0.0%), Assyrian/Chaldean/Syriac (97.0%, a difference of 0.010%), Yuman (97.0%, a difference of 0.010%), Immigrants from Western Asia (97.0%, a difference of 0.010%), and Immigrants from Pakistan (97.0%, a difference of 0.020%).
| Demographics | Rating | Rank | 5th Grade |
| Bahamians | 5.3 /100 | #225 | Tragic 97.0% |
| Tongans | 5.3 /100 | #226 | Tragic 97.0% |
| Immigrants | Pakistan | 4.7 /100 | #227 | Tragic 97.0% |
| Assyrians/Chaldeans/Syriacs | 4.5 /100 | #228 | Tragic 97.0% |
| Yuman | 4.5 /100 | #229 | Tragic 97.0% |
| Immigrants | Western Asia | 4.3 /100 | #230 | Tragic 97.0% |
| Immigrants | Malaysia | 4.1 /100 | #231 | Tragic 97.0% |
| Immigrants | Eastern Asia | 4.0 /100 | #232 | Tragic 97.0% |
| Sub-Saharan Africans | 3.3 /100 | #233 | Tragic 97.0% |
| Tohono O'odham | 3.2 /100 | #234 | Tragic 97.0% |
| Uruguayans | 3.2 /100 | #235 | Tragic 97.0% |
| Senegalese | 2.8 /100 | #236 | Tragic 97.0% |
| Immigrants | Indonesia | 2.0 /100 | #237 | Tragic 96.9% |
| Asians | 2.0 /100 | #238 | Tragic 96.9% |
| Nigerians | 1.9 /100 | #239 | Tragic 96.9% |