Palestinian vs Immigrants from Fiji College, 1 year or more
COMPARE
Palestinian
Immigrants from Fiji
College, 1 year or more
College, 1 year or more Comparison
Palestinians
Immigrants from Fiji
62.0%
COLLEGE, 1 YEAR OR MORE
96.3/ 100
METRIC RATING
106th/ 347
METRIC RANK
56.9%
COLLEGE, 1 YEAR OR MORE
4.0/ 100
METRIC RATING
228th/ 347
METRIC RANK
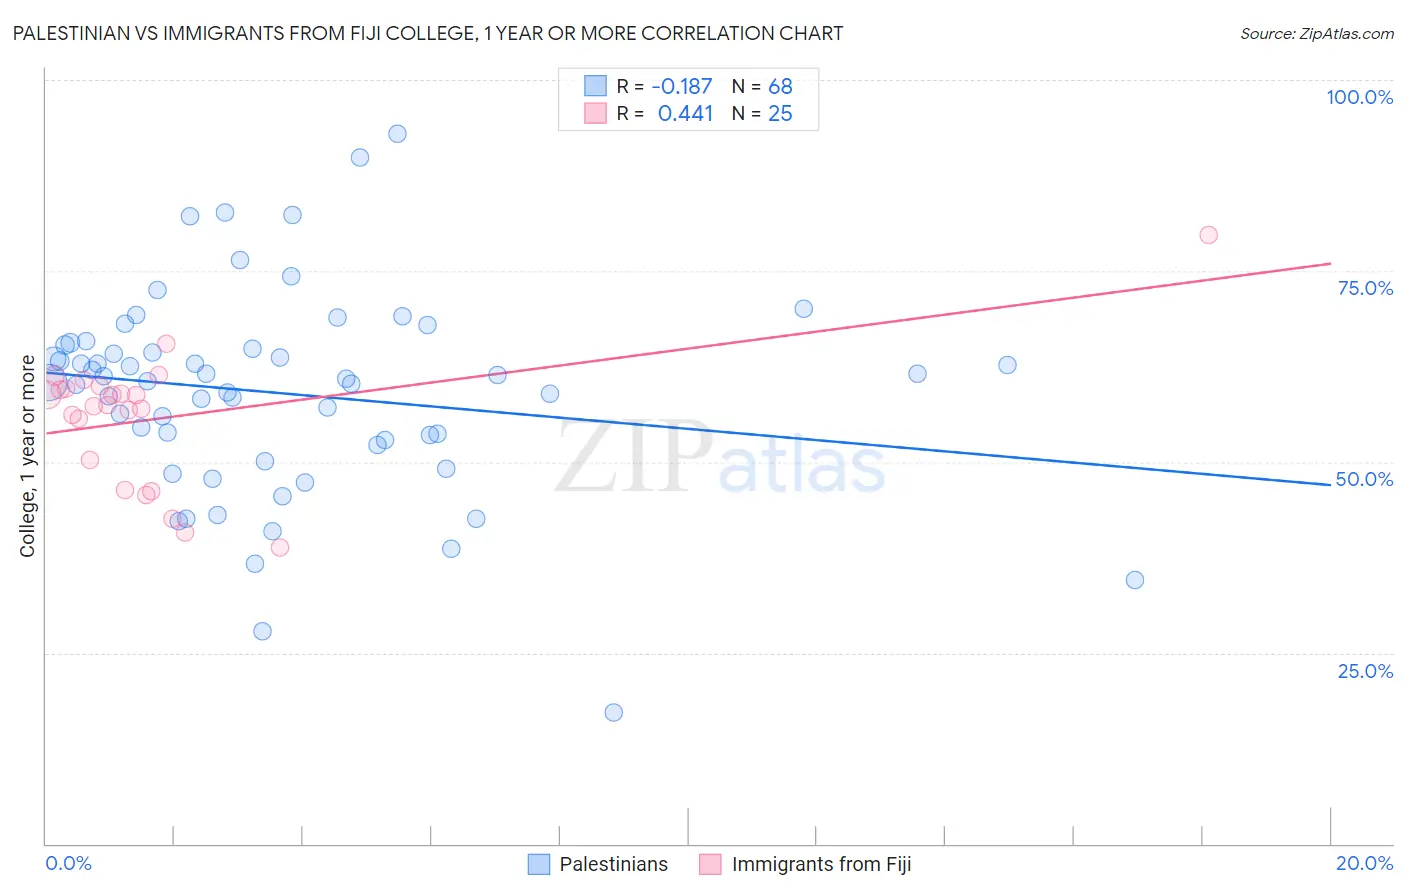
Palestinian vs Immigrants from Fiji College, 1 year or more Correlation Chart
The statistical analysis conducted on geographies consisting of 216,461,838 people shows a poor negative correlation between the proportion of Palestinians and percentage of population with at least college, 1 year or more education in the United States with a correlation coefficient (R) of -0.187 and weighted average of 62.0%. Similarly, the statistical analysis conducted on geographies consisting of 93,755,737 people shows a moderate positive correlation between the proportion of Immigrants from Fiji and percentage of population with at least college, 1 year or more education in the United States with a correlation coefficient (R) of 0.441 and weighted average of 56.9%, a difference of 8.9%.
College, 1 year or more Correlation Summary
| Measurement | Palestinian | Immigrants from Fiji |
| Minimum | 17.1% | 38.9% |
| Maximum | 92.9% | 79.8% |
| Range | 75.8% | 40.9% |
| Mean | 58.9% | 55.8% |
| Median | 60.7% | 57.5% |
| Interquartile 25% (IQ1) | 52.5% | 48.2% |
| Interquartile 75% (IQ3) | 65.1% | 59.8% |
| Interquartile Range (IQR) | 12.6% | 11.5% |
| Standard Deviation (Sample) | 13.4% | 8.8% |
| Standard Deviation (Population) | 13.3% | 8.6% |
Similar Demographics by College, 1 year or more
Demographics Similar to Palestinians by College, 1 year or more
In terms of college, 1 year or more, the demographic groups most similar to Palestinians are Immigrants from Nepal (62.0%, a difference of 0.0%), Chilean (62.0%, a difference of 0.020%), Afghan (62.0%, a difference of 0.030%), Luxembourger (62.1%, a difference of 0.15%), and Icelander (62.1%, a difference of 0.17%).
| Demographics | Rating | Rank | College, 1 year or more |
| Croatians | 97.1 /100 | #99 | Exceptional 62.2% |
| Icelanders | 96.8 /100 | #100 | Exceptional 62.1% |
| Swedes | 96.8 /100 | #101 | Exceptional 62.1% |
| Luxembourgers | 96.7 /100 | #102 | Exceptional 62.1% |
| Afghans | 96.4 /100 | #103 | Exceptional 62.0% |
| Chileans | 96.4 /100 | #104 | Exceptional 62.0% |
| Immigrants | Nepal | 96.3 /100 | #105 | Exceptional 62.0% |
| Palestinians | 96.3 /100 | #106 | Exceptional 62.0% |
| Immigrants | Ukraine | 95.8 /100 | #107 | Exceptional 61.9% |
| Syrians | 95.7 /100 | #108 | Exceptional 61.9% |
| Immigrants | Northern Africa | 95.7 /100 | #109 | Exceptional 61.9% |
| Europeans | 95.6 /100 | #110 | Exceptional 61.8% |
| Macedonians | 95.6 /100 | #111 | Exceptional 61.8% |
| Austrians | 95.4 /100 | #112 | Exceptional 61.8% |
| Ukrainians | 95.2 /100 | #113 | Exceptional 61.8% |
Demographics Similar to Immigrants from Fiji by College, 1 year or more
In terms of college, 1 year or more, the demographic groups most similar to Immigrants from Fiji are Cree (56.8%, a difference of 0.13%), Immigrants (57.0%, a difference of 0.15%), Immigrants from Western Africa (57.0%, a difference of 0.21%), Vietnamese (57.0%, a difference of 0.24%), and Liberian (56.7%, a difference of 0.35%).
| Demographics | Rating | Rank | College, 1 year or more |
| Immigrants | Ghana | 7.7 /100 | #221 | Tragic 57.4% |
| Sub-Saharan Africans | 6.1 /100 | #222 | Tragic 57.3% |
| Portuguese | 5.4 /100 | #223 | Tragic 57.2% |
| Hmong | 5.4 /100 | #224 | Tragic 57.2% |
| Vietnamese | 4.7 /100 | #225 | Tragic 57.0% |
| Immigrants | Western Africa | 4.6 /100 | #226 | Tragic 57.0% |
| Immigrants | Immigrants | 4.4 /100 | #227 | Tragic 57.0% |
| Immigrants | Fiji | 4.0 /100 | #228 | Tragic 56.9% |
| Cree | 3.6 /100 | #229 | Tragic 56.8% |
| Liberians | 3.1 /100 | #230 | Tragic 56.7% |
| Immigrants | Burma/Myanmar | 2.7 /100 | #231 | Tragic 56.6% |
| Immigrants | Bangladesh | 2.6 /100 | #232 | Tragic 56.6% |
| Immigrants | Nonimmigrants | 2.5 /100 | #233 | Tragic 56.5% |
| Spanish Americans | 1.8 /100 | #234 | Tragic 56.3% |
| West Indians | 1.8 /100 | #235 | Tragic 56.3% |