Pakistani vs Northern European Bachelor's Degree
COMPARE
Pakistani
Northern European
Bachelor's Degree
Bachelor's Degree Comparison
Pakistanis
Northern Europeans
39.7%
BACHELOR'S DEGREE
88.2/ 100
METRIC RATING
136th/ 347
METRIC RANK
41.0%
BACHELOR'S DEGREE
96.8/ 100
METRIC RATING
107th/ 347
METRIC RANK
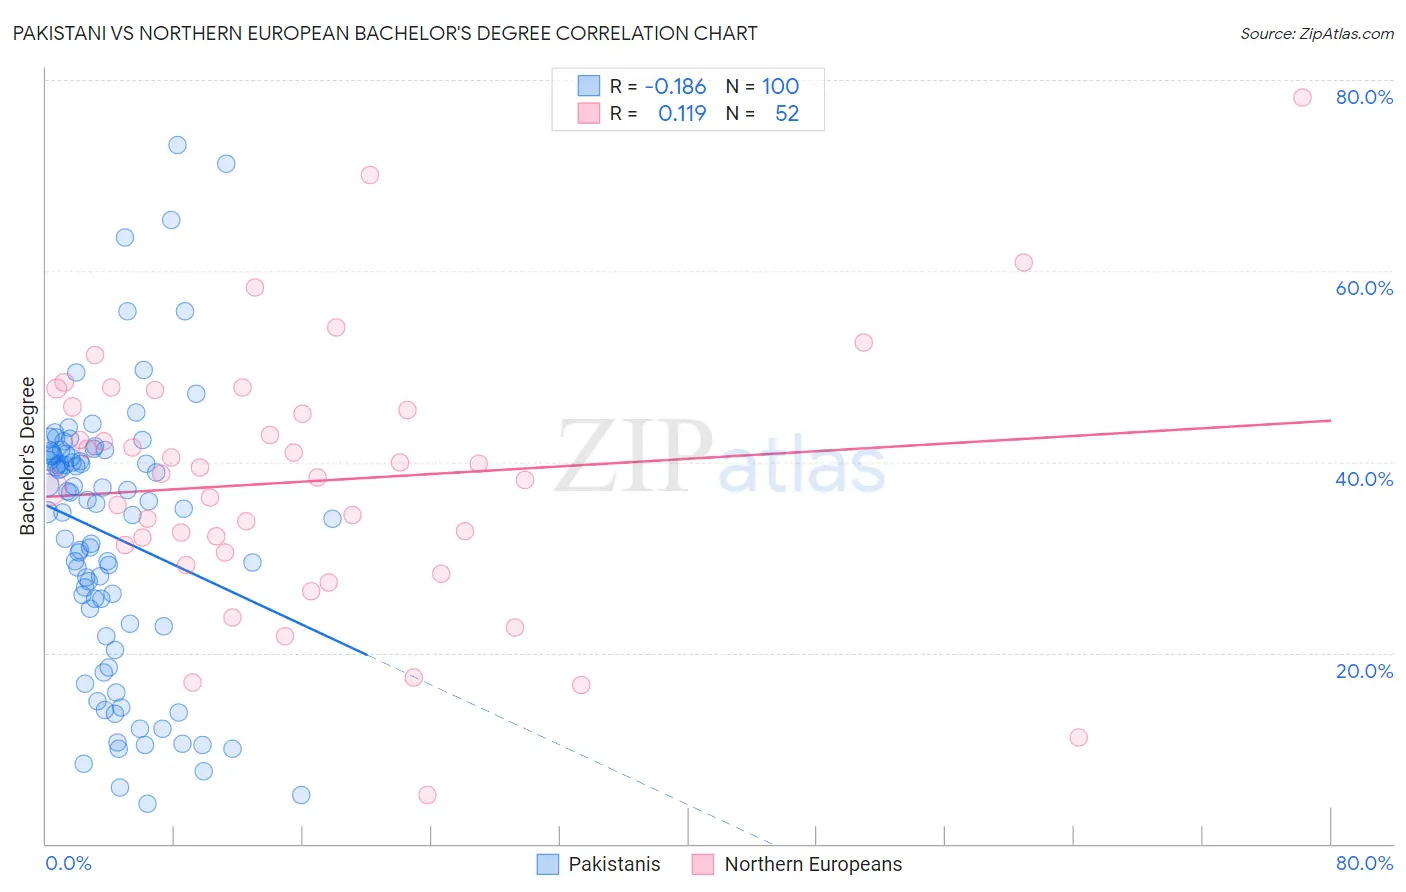
Pakistani vs Northern European Bachelor's Degree Correlation Chart
The statistical analysis conducted on geographies consisting of 335,326,459 people shows a poor negative correlation between the proportion of Pakistanis and percentage of population with at least bachelor's degree education in the United States with a correlation coefficient (R) of -0.186 and weighted average of 39.7%. Similarly, the statistical analysis conducted on geographies consisting of 406,072,770 people shows a poor positive correlation between the proportion of Northern Europeans and percentage of population with at least bachelor's degree education in the United States with a correlation coefficient (R) of 0.119 and weighted average of 41.0%, a difference of 3.3%.
Bachelor's Degree Correlation Summary
| Measurement | Pakistani | Northern European |
| Minimum | 4.2% | 5.1% |
| Maximum | 73.2% | 78.2% |
| Range | 69.0% | 73.1% |
| Mean | 32.3% | 38.0% |
| Median | 35.3% | 38.6% |
| Interquartile 25% (IQ1) | 22.9% | 30.9% |
| Interquartile 75% (IQ3) | 40.7% | 45.6% |
| Interquartile Range (IQR) | 17.9% | 14.7% |
| Standard Deviation (Sample) | 14.3% | 13.7% |
| Standard Deviation (Population) | 14.3% | 13.5% |
Similar Demographics by Bachelor's Degree
Demographics Similar to Pakistanis by Bachelor's Degree
In terms of bachelor's degree, the demographic groups most similar to Pakistanis are Luxembourger (39.8%, a difference of 0.20%), Assyrian/Chaldean/Syriac (39.8%, a difference of 0.28%), Icelander (39.5%, a difference of 0.37%), European (39.5%, a difference of 0.54%), and Immigrants from Southern Europe (40.0%, a difference of 0.71%).
| Demographics | Rating | Rank | Bachelor's Degree |
| Serbians | 92.4 /100 | #129 | Exceptional 40.1% |
| Sierra Leoneans | 92.2 /100 | #130 | Exceptional 40.1% |
| Italians | 91.9 /100 | #131 | Exceptional 40.1% |
| Taiwanese | 91.1 /100 | #132 | Exceptional 40.0% |
| Immigrants | Southern Europe | 91.1 /100 | #133 | Exceptional 40.0% |
| Assyrians/Chaldeans/Syriacs | 89.4 /100 | #134 | Excellent 39.8% |
| Luxembourgers | 89.1 /100 | #135 | Excellent 39.8% |
| Pakistanis | 88.2 /100 | #136 | Excellent 39.7% |
| Icelanders | 86.5 /100 | #137 | Excellent 39.5% |
| Europeans | 85.6 /100 | #138 | Excellent 39.5% |
| Immigrants | Sudan | 84.5 /100 | #139 | Excellent 39.4% |
| Immigrants | Armenia | 84.1 /100 | #140 | Excellent 39.4% |
| South American Indians | 83.6 /100 | #141 | Excellent 39.3% |
| Immigrants | North Macedonia | 81.6 /100 | #142 | Excellent 39.2% |
| Poles | 79.8 /100 | #143 | Good 39.1% |
Demographics Similar to Northern Europeans by Bachelor's Degree
In terms of bachelor's degree, the demographic groups most similar to Northern Europeans are Ukrainian (40.9%, a difference of 0.14%), Arab (40.9%, a difference of 0.16%), Alsatian (41.0%, a difference of 0.17%), Albanian (40.9%, a difference of 0.24%), and Immigrants from Chile (40.8%, a difference of 0.28%).
| Demographics | Rating | Rank | Bachelor's Degree |
| Macedonians | 98.1 /100 | #100 | Exceptional 41.4% |
| Immigrants | Morocco | 98.0 /100 | #101 | Exceptional 41.4% |
| Immigrants | Italy | 97.8 /100 | #102 | Exceptional 41.3% |
| Chileans | 97.5 /100 | #103 | Exceptional 41.2% |
| Jordanians | 97.4 /100 | #104 | Exceptional 41.2% |
| Syrians | 97.4 /100 | #105 | Exceptional 41.1% |
| Alsatians | 97.0 /100 | #106 | Exceptional 41.0% |
| Northern Europeans | 96.8 /100 | #107 | Exceptional 41.0% |
| Ukrainians | 96.6 /100 | #108 | Exceptional 40.9% |
| Arabs | 96.6 /100 | #109 | Exceptional 40.9% |
| Albanians | 96.5 /100 | #110 | Exceptional 40.9% |
| Immigrants | Chile | 96.4 /100 | #111 | Exceptional 40.8% |
| Ugandans | 96.3 /100 | #112 | Exceptional 40.8% |
| Brazilians | 96.3 /100 | #113 | Exceptional 40.8% |
| Afghans | 96.2 /100 | #114 | Exceptional 40.8% |