Pakistani vs Immigrants from Hong Kong Bachelor's Degree
COMPARE
Pakistani
Immigrants from Hong Kong
Bachelor's Degree
Bachelor's Degree Comparison
Pakistanis
Immigrants from Hong Kong
39.7%
BACHELOR'S DEGREE
88.2/ 100
METRIC RATING
136th/ 347
METRIC RANK
48.2%
BACHELOR'S DEGREE
100.0/ 100
METRIC RATING
14th/ 347
METRIC RANK
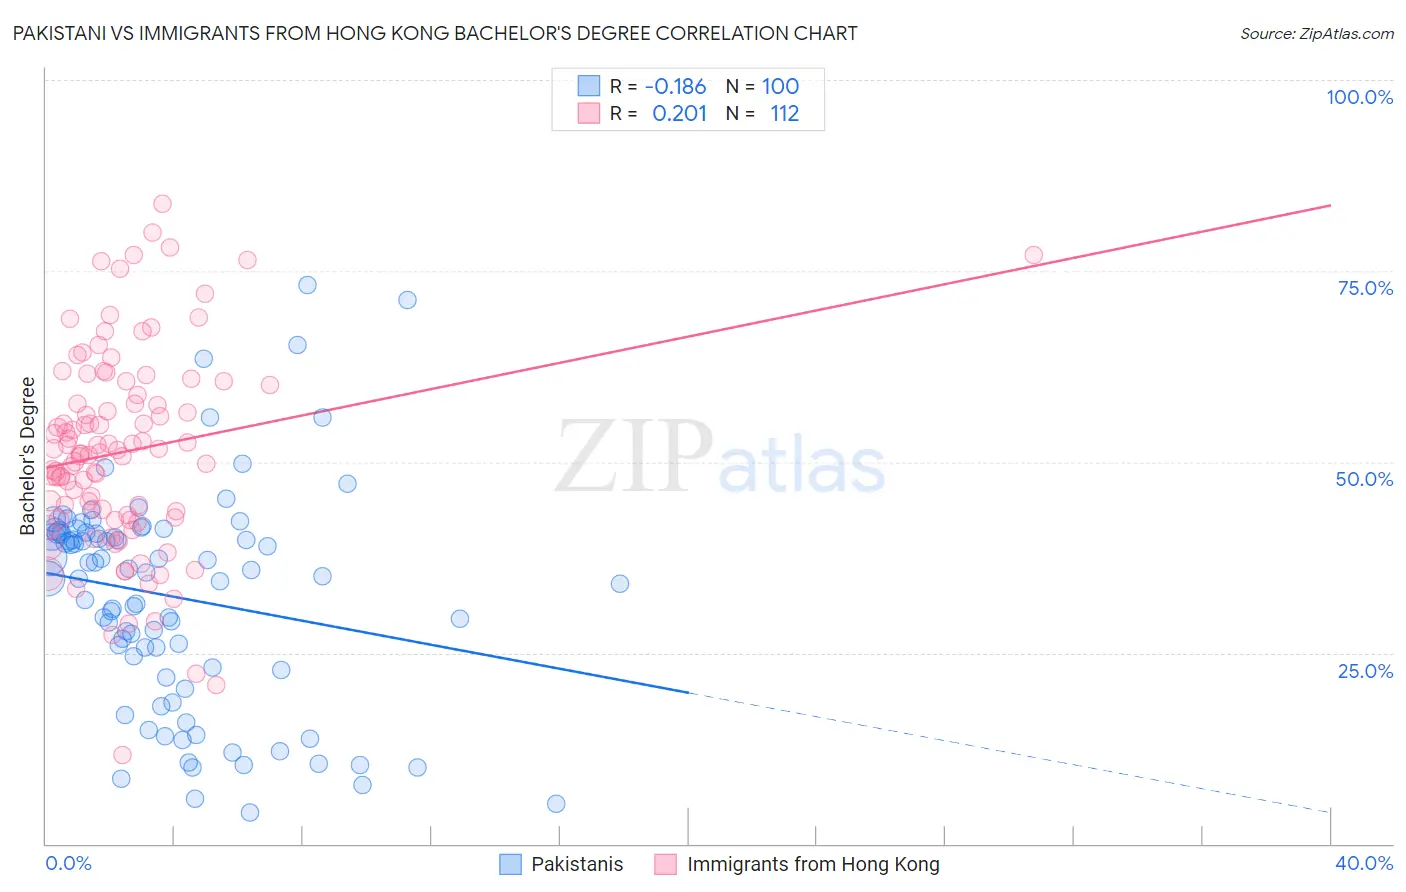
Pakistani vs Immigrants from Hong Kong Bachelor's Degree Correlation Chart
The statistical analysis conducted on geographies consisting of 335,326,459 people shows a poor negative correlation between the proportion of Pakistanis and percentage of population with at least bachelor's degree education in the United States with a correlation coefficient (R) of -0.186 and weighted average of 39.7%. Similarly, the statistical analysis conducted on geographies consisting of 253,986,152 people shows a weak positive correlation between the proportion of Immigrants from Hong Kong and percentage of population with at least bachelor's degree education in the United States with a correlation coefficient (R) of 0.201 and weighted average of 48.2%, a difference of 21.5%.
Bachelor's Degree Correlation Summary
| Measurement | Pakistani | Immigrants from Hong Kong |
| Minimum | 4.2% | 11.7% |
| Maximum | 73.2% | 83.9% |
| Range | 69.0% | 72.2% |
| Mean | 32.3% | 51.3% |
| Median | 35.3% | 51.2% |
| Interquartile 25% (IQ1) | 22.9% | 42.9% |
| Interquartile 75% (IQ3) | 40.7% | 59.4% |
| Interquartile Range (IQR) | 17.9% | 16.5% |
| Standard Deviation (Sample) | 14.3% | 13.2% |
| Standard Deviation (Population) | 14.3% | 13.1% |
Similar Demographics by Bachelor's Degree
Demographics Similar to Pakistanis by Bachelor's Degree
In terms of bachelor's degree, the demographic groups most similar to Pakistanis are Luxembourger (39.8%, a difference of 0.20%), Assyrian/Chaldean/Syriac (39.8%, a difference of 0.28%), Icelander (39.5%, a difference of 0.37%), European (39.5%, a difference of 0.54%), and Immigrants from Southern Europe (40.0%, a difference of 0.71%).
| Demographics | Rating | Rank | Bachelor's Degree |
| Serbians | 92.4 /100 | #129 | Exceptional 40.1% |
| Sierra Leoneans | 92.2 /100 | #130 | Exceptional 40.1% |
| Italians | 91.9 /100 | #131 | Exceptional 40.1% |
| Taiwanese | 91.1 /100 | #132 | Exceptional 40.0% |
| Immigrants | Southern Europe | 91.1 /100 | #133 | Exceptional 40.0% |
| Assyrians/Chaldeans/Syriacs | 89.4 /100 | #134 | Excellent 39.8% |
| Luxembourgers | 89.1 /100 | #135 | Excellent 39.8% |
| Pakistanis | 88.2 /100 | #136 | Excellent 39.7% |
| Icelanders | 86.5 /100 | #137 | Excellent 39.5% |
| Europeans | 85.6 /100 | #138 | Excellent 39.5% |
| Immigrants | Sudan | 84.5 /100 | #139 | Excellent 39.4% |
| Immigrants | Armenia | 84.1 /100 | #140 | Excellent 39.4% |
| South American Indians | 83.6 /100 | #141 | Excellent 39.3% |
| Immigrants | North Macedonia | 81.6 /100 | #142 | Excellent 39.2% |
| Poles | 79.8 /100 | #143 | Good 39.1% |
Demographics Similar to Immigrants from Hong Kong by Bachelor's Degree
In terms of bachelor's degree, the demographic groups most similar to Immigrants from Hong Kong are Immigrants from Eastern Asia (48.1%, a difference of 0.14%), Immigrants from South Central Asia (48.3%, a difference of 0.28%), Immigrants from China (48.4%, a difference of 0.42%), Immigrants from Australia (48.5%, a difference of 0.60%), and Soviet Union (47.9%, a difference of 0.60%).
| Demographics | Rating | Rank | Bachelor's Degree |
| Immigrants | Iran | 100.0 /100 | #7 | Exceptional 50.3% |
| Thais | 100.0 /100 | #8 | Exceptional 50.1% |
| Immigrants | Israel | 100.0 /100 | #9 | Exceptional 50.0% |
| Cypriots | 100.0 /100 | #10 | Exceptional 49.0% |
| Immigrants | Australia | 100.0 /100 | #11 | Exceptional 48.5% |
| Immigrants | China | 100.0 /100 | #12 | Exceptional 48.4% |
| Immigrants | South Central Asia | 100.0 /100 | #13 | Exceptional 48.3% |
| Immigrants | Hong Kong | 100.0 /100 | #14 | Exceptional 48.2% |
| Immigrants | Eastern Asia | 100.0 /100 | #15 | Exceptional 48.1% |
| Soviet Union | 100.0 /100 | #16 | Exceptional 47.9% |
| Eastern Europeans | 100.0 /100 | #17 | Exceptional 47.5% |
| Indians (Asian) | 100.0 /100 | #18 | Exceptional 47.4% |
| Cambodians | 100.0 /100 | #19 | Exceptional 47.2% |
| Immigrants | Switzerland | 100.0 /100 | #20 | Exceptional 47.1% |
| Immigrants | Ireland | 100.0 /100 | #21 | Exceptional 47.1% |