Pakistani vs Bhutanese Nursery School
COMPARE
Pakistani
Bhutanese
Nursery School
Nursery School Comparison
Pakistanis
Bhutanese
97.9%
NURSERY SCHOOL
34.6/ 100
METRIC RATING
189th/ 347
METRIC RANK
98.2%
NURSERY SCHOOL
97.4/ 100
METRIC RATING
104th/ 347
METRIC RANK
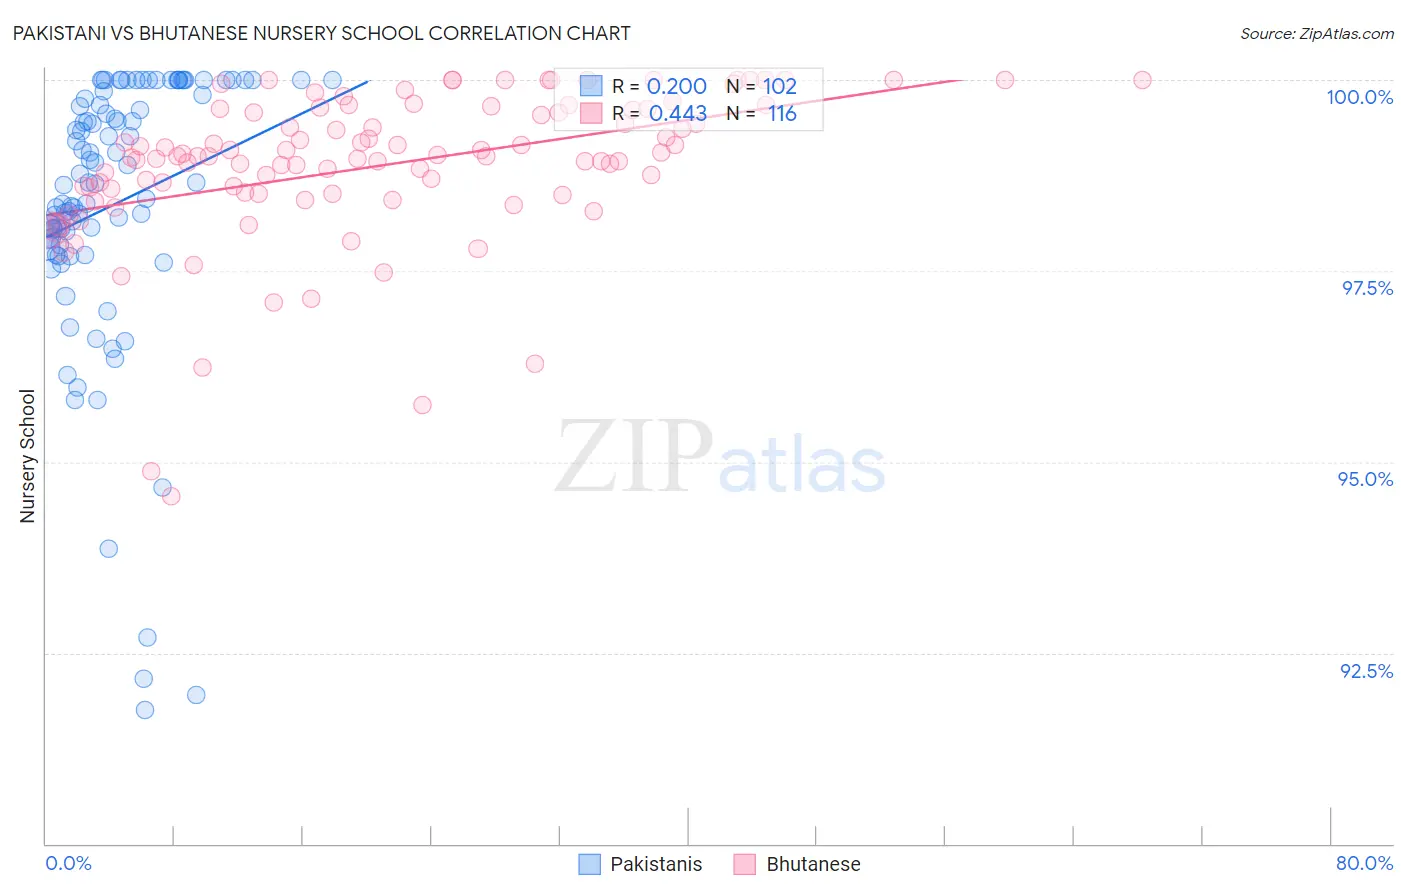
Pakistani vs Bhutanese Nursery School Correlation Chart
The statistical analysis conducted on geographies consisting of 335,355,426 people shows a poor positive correlation between the proportion of Pakistanis and percentage of population with at least nursery school education in the United States with a correlation coefficient (R) of 0.200 and weighted average of 97.9%. Similarly, the statistical analysis conducted on geographies consisting of 455,591,119 people shows a moderate positive correlation between the proportion of Bhutanese and percentage of population with at least nursery school education in the United States with a correlation coefficient (R) of 0.443 and weighted average of 98.2%, a difference of 0.32%.
Nursery School Correlation Summary
| Measurement | Pakistani | Bhutanese |
| Minimum | 91.8% | 94.6% |
| Maximum | 100.0% | 100.0% |
| Range | 8.2% | 5.4% |
| Mean | 98.4% | 98.9% |
| Median | 98.6% | 99.0% |
| Interquartile 25% (IQ1) | 97.8% | 98.5% |
| Interquartile 75% (IQ3) | 99.8% | 99.6% |
| Interquartile Range (IQR) | 2.0% | 1.1% |
| Standard Deviation (Sample) | 1.8% | 1.0% |
| Standard Deviation (Population) | 1.8% | 1.00% |
Similar Demographics by Nursery School
Demographics Similar to Pakistanis by Nursery School
In terms of nursery school, the demographic groups most similar to Pakistanis are Arab (97.9%, a difference of 0.0%), Panamanian (97.9%, a difference of 0.0%), Immigrants from Kazakhstan (97.9%, a difference of 0.010%), Immigrants from Taiwan (97.9%, a difference of 0.010%), and Paiute (98.0%, a difference of 0.020%).
| Demographics | Rating | Rank | Nursery School |
| Paiute | 42.0 /100 | #182 | Average 98.0% |
| Portuguese | 41.8 /100 | #183 | Average 98.0% |
| Immigrants | Poland | 41.3 /100 | #184 | Average 98.0% |
| Immigrants | Belarus | 41.0 /100 | #185 | Average 98.0% |
| Immigrants | Argentina | 40.8 /100 | #186 | Average 98.0% |
| Immigrants | Kazakhstan | 37.1 /100 | #187 | Fair 97.9% |
| Arabs | 34.7 /100 | #188 | Fair 97.9% |
| Pakistanis | 34.6 /100 | #189 | Fair 97.9% |
| Panamanians | 34.3 /100 | #190 | Fair 97.9% |
| Immigrants | Taiwan | 30.6 /100 | #191 | Fair 97.9% |
| Blacks/African Americans | 29.4 /100 | #192 | Fair 97.9% |
| Paraguayans | 27.4 /100 | #193 | Fair 97.9% |
| Mongolians | 27.3 /100 | #194 | Fair 97.9% |
| Hawaiians | 27.2 /100 | #195 | Fair 97.9% |
| Guamanians/Chamorros | 25.7 /100 | #196 | Fair 97.9% |
Demographics Similar to Bhutanese by Nursery School
In terms of nursery school, the demographic groups most similar to Bhutanese are Turkish (98.2%, a difference of 0.0%), Immigrants from Switzerland (98.2%, a difference of 0.0%), Basque (98.2%, a difference of 0.0%), Immigrants from Ireland (98.3%, a difference of 0.010%), and Cree (98.3%, a difference of 0.010%).
| Demographics | Rating | Rank | Nursery School |
| Immigrants | Nonimmigrants | 98.3 /100 | #97 | Exceptional 98.3% |
| Choctaw | 98.3 /100 | #98 | Exceptional 98.3% |
| Colville | 98.2 /100 | #99 | Exceptional 98.3% |
| Puget Sound Salish | 98.0 /100 | #100 | Exceptional 98.3% |
| Romanians | 97.9 /100 | #101 | Exceptional 98.3% |
| Immigrants | Ireland | 97.7 /100 | #102 | Exceptional 98.3% |
| Cree | 97.7 /100 | #103 | Exceptional 98.3% |
| Bhutanese | 97.4 /100 | #104 | Exceptional 98.2% |
| Turks | 97.4 /100 | #105 | Exceptional 98.2% |
| Immigrants | Switzerland | 97.3 /100 | #106 | Exceptional 98.2% |
| Basques | 97.3 /100 | #107 | Exceptional 98.2% |
| Pima | 97.1 /100 | #108 | Exceptional 98.2% |
| German Russians | 97.1 /100 | #109 | Exceptional 98.2% |
| Immigrants | Singapore | 96.9 /100 | #110 | Exceptional 98.2% |
| Immigrants | Czechoslovakia | 96.8 /100 | #111 | Exceptional 98.2% |