Paiute vs Yup'ik Doctorate Degree
COMPARE
Paiute
Yup'ik
Doctorate Degree
Doctorate Degree Comparison
Paiute
Yup'ik
1.5%
DOCTORATE DEGREE
0.4/ 100
METRIC RATING
276th/ 347
METRIC RANK
1.3%
DOCTORATE DEGREE
0.0/ 100
METRIC RATING
330th/ 347
METRIC RANK
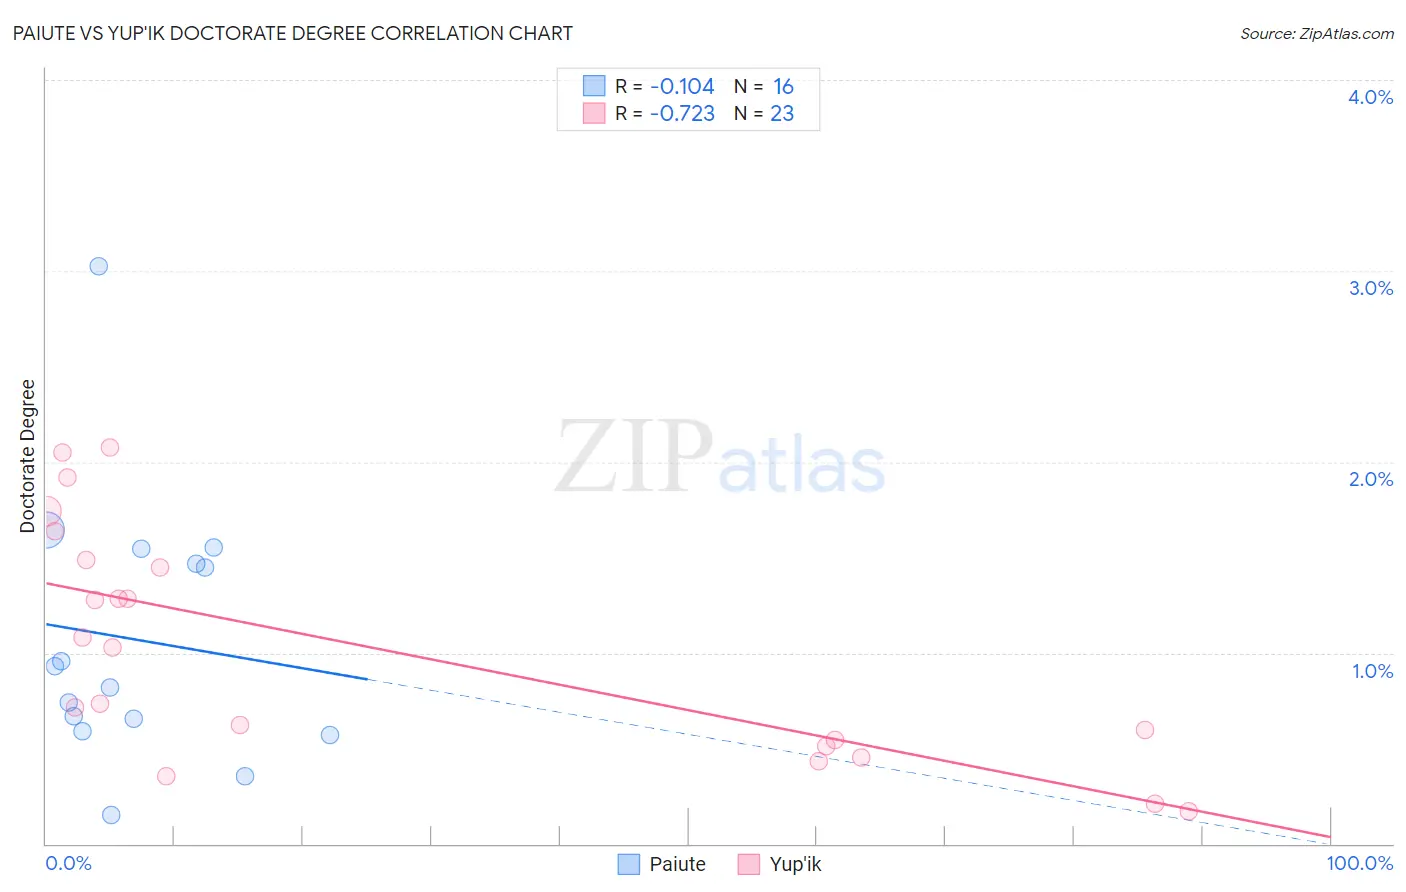
Paiute vs Yup'ik Doctorate Degree Correlation Chart
The statistical analysis conducted on geographies consisting of 58,124,272 people shows a poor negative correlation between the proportion of Paiute and percentage of population with at least doctorate degree education in the United States with a correlation coefficient (R) of -0.104 and weighted average of 1.5%. Similarly, the statistical analysis conducted on geographies consisting of 39,714,218 people shows a strong negative correlation between the proportion of Yup'ik and percentage of population with at least doctorate degree education in the United States with a correlation coefficient (R) of -0.723 and weighted average of 1.3%, a difference of 12.8%.
Doctorate Degree Correlation Summary
| Measurement | Paiute | Yup'ik |
| Minimum | 0.15% | 0.17% |
| Maximum | 3.0% | 2.1% |
| Range | 2.9% | 1.9% |
| Mean | 1.1% | 1.0% |
| Median | 0.88% | 1.0% |
| Interquartile 25% (IQ1) | 0.62% | 0.51% |
| Interquartile 75% (IQ3) | 1.5% | 1.5% |
| Interquartile Range (IQR) | 0.88% | 0.97% |
| Standard Deviation (Sample) | 0.70% | 0.60% |
| Standard Deviation (Population) | 0.67% | 0.59% |
Similar Demographics by Doctorate Degree
Demographics Similar to Paiute by Doctorate Degree
In terms of doctorate degree, the demographic groups most similar to Paiute are Aleut (1.5%, a difference of 0.050%), Yaqui (1.5%, a difference of 0.17%), Sioux (1.5%, a difference of 0.19%), Immigrants from Barbados (1.5%, a difference of 0.30%), and Immigrants from Trinidad and Tobago (1.5%, a difference of 0.39%).
| Demographics | Rating | Rank | Doctorate Degree |
| Crow | 0.5 /100 | #269 | Tragic 1.5% |
| Salvadorans | 0.5 /100 | #270 | Tragic 1.5% |
| Immigrants | Trinidad and Tobago | 0.5 /100 | #271 | Tragic 1.5% |
| Immigrants | Barbados | 0.4 /100 | #272 | Tragic 1.5% |
| Sioux | 0.4 /100 | #273 | Tragic 1.5% |
| Yaqui | 0.4 /100 | #274 | Tragic 1.5% |
| Aleuts | 0.4 /100 | #275 | Tragic 1.5% |
| Paiute | 0.4 /100 | #276 | Tragic 1.5% |
| Bahamians | 0.4 /100 | #277 | Tragic 1.5% |
| Hawaiians | 0.4 /100 | #278 | Tragic 1.5% |
| Marshallese | 0.4 /100 | #279 | Tragic 1.5% |
| Ecuadorians | 0.4 /100 | #280 | Tragic 1.5% |
| Tohono O'odham | 0.4 /100 | #281 | Tragic 1.5% |
| British West Indians | 0.3 /100 | #282 | Tragic 1.5% |
| Central Americans | 0.3 /100 | #283 | Tragic 1.5% |
Demographics Similar to Yup'ik by Doctorate Degree
In terms of doctorate degree, the demographic groups most similar to Yup'ik are Immigrants from Latin America (1.3%, a difference of 0.010%), Haitian (1.3%, a difference of 0.22%), Inupiat (1.3%, a difference of 0.27%), Hispanic or Latino (1.3%, a difference of 0.85%), and Immigrants from Cabo Verde (1.3%, a difference of 1.1%).
| Demographics | Rating | Rank | Doctorate Degree |
| Immigrants | Belize | 0.1 /100 | #323 | Tragic 1.3% |
| Natives/Alaskans | 0.0 /100 | #324 | Tragic 1.3% |
| Pima | 0.0 /100 | #325 | Tragic 1.3% |
| Immigrants | Cabo Verde | 0.0 /100 | #326 | Tragic 1.3% |
| Hispanics or Latinos | 0.0 /100 | #327 | Tragic 1.3% |
| Inupiat | 0.0 /100 | #328 | Tragic 1.3% |
| Haitians | 0.0 /100 | #329 | Tragic 1.3% |
| Yup'ik | 0.0 /100 | #330 | Tragic 1.3% |
| Immigrants | Latin America | 0.0 /100 | #331 | Tragic 1.3% |
| Yakama | 0.0 /100 | #332 | Tragic 1.3% |
| Immigrants | Caribbean | 0.0 /100 | #333 | Tragic 1.3% |
| Immigrants | Dominican Republic | 0.0 /100 | #334 | Tragic 1.3% |
| Immigrants | Haiti | 0.0 /100 | #335 | Tragic 1.3% |
| Nepalese | 0.0 /100 | #336 | Tragic 1.3% |
| Bangladeshis | 0.0 /100 | #337 | Tragic 1.2% |