Paiute vs Immigrants from South Central Asia Doctorate Degree
COMPARE
Paiute
Immigrants from South Central Asia
Doctorate Degree
Doctorate Degree Comparison
Paiute
Immigrants from South Central Asia
1.5%
DOCTORATE DEGREE
0.4/ 100
METRIC RATING
276th/ 347
METRIC RANK
2.6%
DOCTORATE DEGREE
100.0/ 100
METRIC RATING
29th/ 347
METRIC RANK
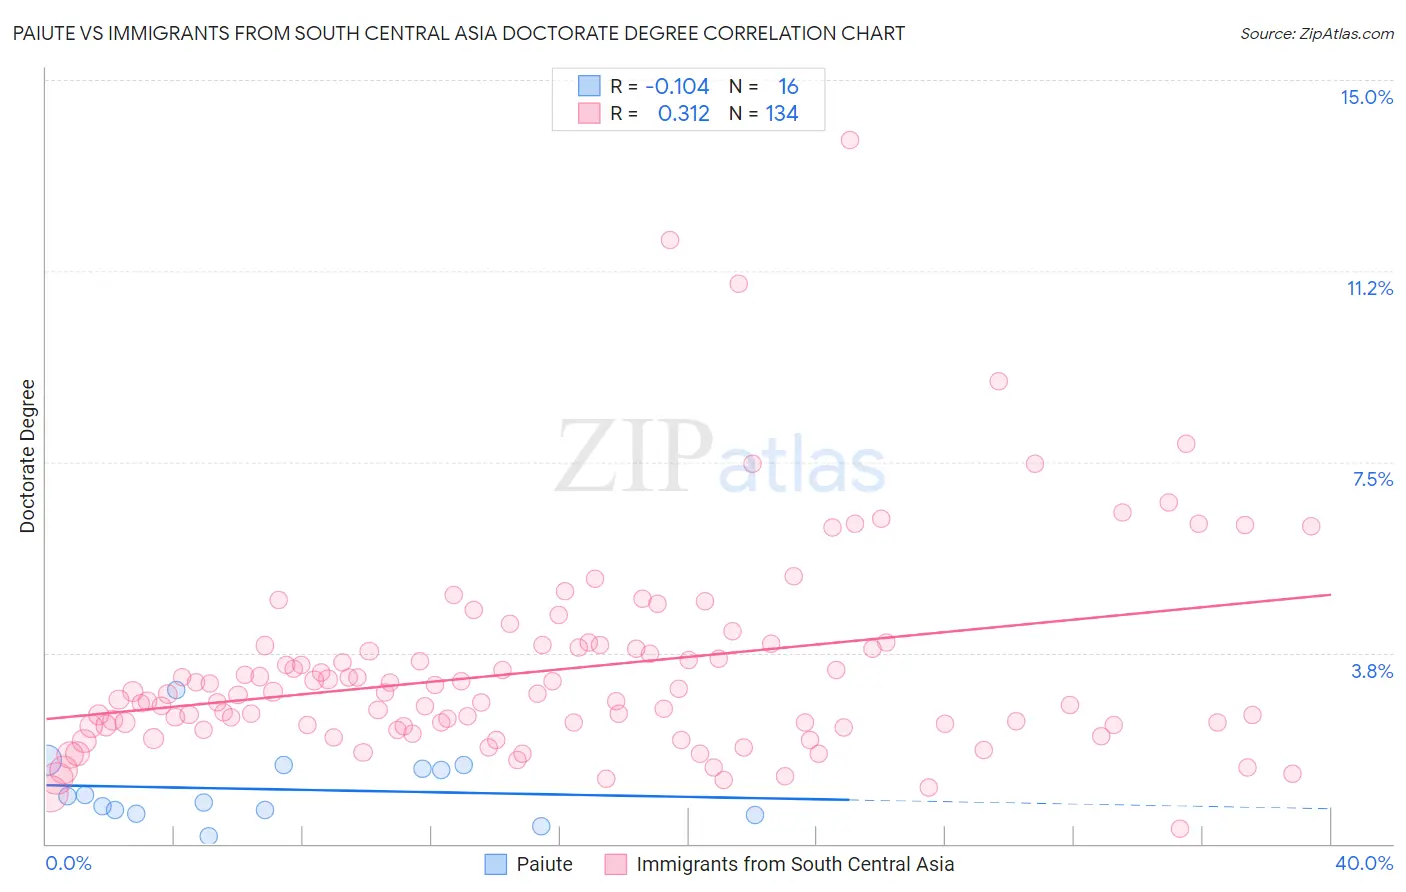
Paiute vs Immigrants from South Central Asia Doctorate Degree Correlation Chart
The statistical analysis conducted on geographies consisting of 58,124,272 people shows a poor negative correlation between the proportion of Paiute and percentage of population with at least doctorate degree education in the United States with a correlation coefficient (R) of -0.104 and weighted average of 1.5%. Similarly, the statistical analysis conducted on geographies consisting of 467,603,630 people shows a mild positive correlation between the proportion of Immigrants from South Central Asia and percentage of population with at least doctorate degree education in the United States with a correlation coefficient (R) of 0.312 and weighted average of 2.6%, a difference of 78.8%.
Doctorate Degree Correlation Summary
| Measurement | Paiute | Immigrants from South Central Asia |
| Minimum | 0.15% | 0.30% |
| Maximum | 3.0% | 13.8% |
| Range | 2.9% | 13.5% |
| Mean | 1.1% | 3.4% |
| Median | 0.88% | 2.9% |
| Interquartile 25% (IQ1) | 0.62% | 2.3% |
| Interquartile 75% (IQ3) | 1.5% | 3.8% |
| Interquartile Range (IQR) | 0.88% | 1.5% |
| Standard Deviation (Sample) | 0.70% | 2.0% |
| Standard Deviation (Population) | 0.67% | 2.0% |
Similar Demographics by Doctorate Degree
Demographics Similar to Paiute by Doctorate Degree
In terms of doctorate degree, the demographic groups most similar to Paiute are Aleut (1.5%, a difference of 0.050%), Yaqui (1.5%, a difference of 0.17%), Sioux (1.5%, a difference of 0.19%), Immigrants from Barbados (1.5%, a difference of 0.30%), and Immigrants from Trinidad and Tobago (1.5%, a difference of 0.39%).
| Demographics | Rating | Rank | Doctorate Degree |
| Crow | 0.5 /100 | #269 | Tragic 1.5% |
| Salvadorans | 0.5 /100 | #270 | Tragic 1.5% |
| Immigrants | Trinidad and Tobago | 0.5 /100 | #271 | Tragic 1.5% |
| Immigrants | Barbados | 0.4 /100 | #272 | Tragic 1.5% |
| Sioux | 0.4 /100 | #273 | Tragic 1.5% |
| Yaqui | 0.4 /100 | #274 | Tragic 1.5% |
| Aleuts | 0.4 /100 | #275 | Tragic 1.5% |
| Paiute | 0.4 /100 | #276 | Tragic 1.5% |
| Bahamians | 0.4 /100 | #277 | Tragic 1.5% |
| Hawaiians | 0.4 /100 | #278 | Tragic 1.5% |
| Marshallese | 0.4 /100 | #279 | Tragic 1.5% |
| Ecuadorians | 0.4 /100 | #280 | Tragic 1.5% |
| Tohono O'odham | 0.4 /100 | #281 | Tragic 1.5% |
| British West Indians | 0.3 /100 | #282 | Tragic 1.5% |
| Central Americans | 0.3 /100 | #283 | Tragic 1.5% |
Demographics Similar to Immigrants from South Central Asia by Doctorate Degree
In terms of doctorate degree, the demographic groups most similar to Immigrants from South Central Asia are Immigrants from Korea (2.6%, a difference of 0.040%), Burmese (2.6%, a difference of 0.26%), Immigrants from Turkey (2.6%, a difference of 0.57%), Turkish (2.7%, a difference of 1.4%), and Immigrants from Saudi Arabia (2.7%, a difference of 2.0%).
| Demographics | Rating | Rank | Doctorate Degree |
| Mongolians | 100.0 /100 | #22 | Exceptional 2.8% |
| Immigrants | Denmark | 100.0 /100 | #23 | Exceptional 2.8% |
| Israelis | 100.0 /100 | #24 | Exceptional 2.7% |
| Immigrants | Saudi Arabia | 100.0 /100 | #25 | Exceptional 2.7% |
| Turks | 100.0 /100 | #26 | Exceptional 2.7% |
| Immigrants | Turkey | 100.0 /100 | #27 | Exceptional 2.6% |
| Burmese | 100.0 /100 | #28 | Exceptional 2.6% |
| Immigrants | South Central Asia | 100.0 /100 | #29 | Exceptional 2.6% |
| Immigrants | Korea | 100.0 /100 | #30 | Exceptional 2.6% |
| Latvians | 100.0 /100 | #31 | Exceptional 2.6% |
| Immigrants | Northern Europe | 100.0 /100 | #32 | Exceptional 2.6% |
| Cambodians | 100.0 /100 | #33 | Exceptional 2.6% |
| Cypriots | 100.0 /100 | #34 | Exceptional 2.6% |
| Immigrants | Malaysia | 100.0 /100 | #35 | Exceptional 2.6% |
| Immigrants | Spain | 100.0 /100 | #36 | Exceptional 2.6% |