American vs Immigrants from Northern Europe Professional Degree
COMPARE
American
Immigrants from Northern Europe
Professional Degree
Professional Degree Comparison
Americans
Immigrants from Northern Europe
3.6%
PROFESSIONAL DEGREE
0.5/ 100
METRIC RATING
273rd/ 347
METRIC RANK
6.2%
PROFESSIONAL DEGREE
100.0/ 100
METRIC RATING
27th/ 347
METRIC RANK
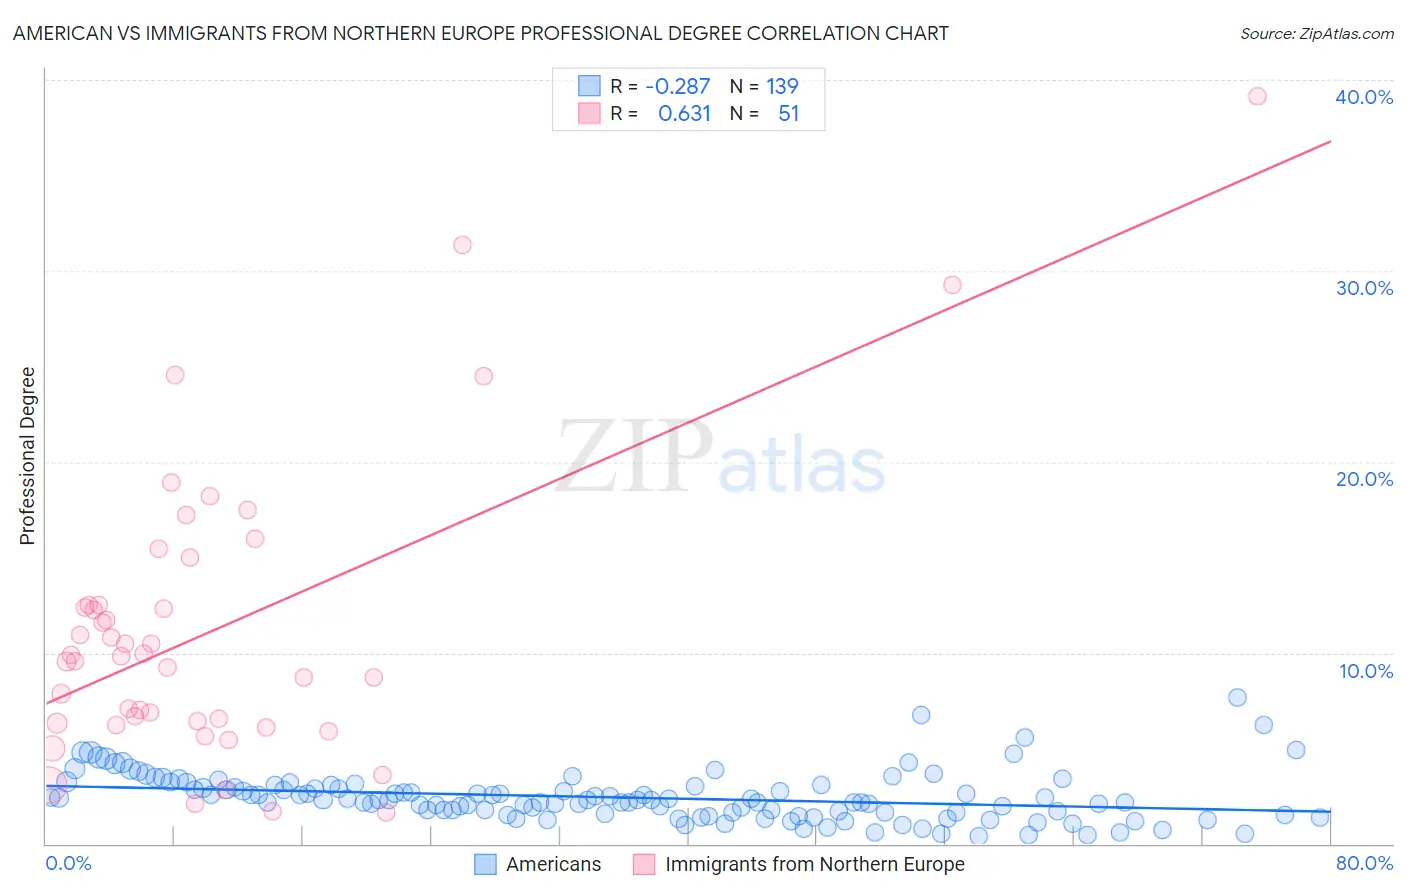
American vs Immigrants from Northern Europe Professional Degree Correlation Chart
The statistical analysis conducted on geographies consisting of 570,969,920 people shows a weak negative correlation between the proportion of Americans and percentage of population with at least professional degree education in the United States with a correlation coefficient (R) of -0.287 and weighted average of 3.6%. Similarly, the statistical analysis conducted on geographies consisting of 475,703,825 people shows a significant positive correlation between the proportion of Immigrants from Northern Europe and percentage of population with at least professional degree education in the United States with a correlation coefficient (R) of 0.631 and weighted average of 6.2%, a difference of 74.3%.
Professional Degree Correlation Summary
| Measurement | American | Immigrants from Northern Europe |
| Minimum | 0.39% | 1.7% |
| Maximum | 7.7% | 39.2% |
| Range | 7.3% | 37.5% |
| Mean | 2.4% | 11.3% |
| Median | 2.3% | 9.8% |
| Interquartile 25% (IQ1) | 1.6% | 6.3% |
| Interquartile 75% (IQ3) | 3.0% | 12.5% |
| Interquartile Range (IQR) | 1.4% | 6.2% |
| Standard Deviation (Sample) | 1.2% | 7.7% |
| Standard Deviation (Population) | 1.2% | 7.6% |
Similar Demographics by Professional Degree
Demographics Similar to Americans by Professional Degree
In terms of professional degree, the demographic groups most similar to Americans are Immigrants from Jamaica (3.6%, a difference of 0.060%), Belizean (3.6%, a difference of 0.090%), Potawatomi (3.6%, a difference of 0.13%), Immigrants from Dominica (3.6%, a difference of 0.35%), and Liberian (3.6%, a difference of 0.40%).
| Demographics | Rating | Rank | Professional Degree |
| Central American Indians | 0.8 /100 | #266 | Tragic 3.6% |
| Delaware | 0.7 /100 | #267 | Tragic 3.6% |
| Aleuts | 0.7 /100 | #268 | Tragic 3.6% |
| Immigrants | Cuba | 0.6 /100 | #269 | Tragic 3.6% |
| Central Americans | 0.6 /100 | #270 | Tragic 3.6% |
| Belizeans | 0.5 /100 | #271 | Tragic 3.6% |
| Immigrants | Jamaica | 0.5 /100 | #272 | Tragic 3.6% |
| Americans | 0.5 /100 | #273 | Tragic 3.6% |
| Potawatomi | 0.5 /100 | #274 | Tragic 3.6% |
| Immigrants | Dominica | 0.5 /100 | #275 | Tragic 3.6% |
| Liberians | 0.5 /100 | #276 | Tragic 3.6% |
| Cheyenne | 0.5 /100 | #277 | Tragic 3.6% |
| Japanese | 0.5 /100 | #278 | Tragic 3.5% |
| Immigrants | Portugal | 0.5 /100 | #279 | Tragic 3.5% |
| Dominicans | 0.5 /100 | #280 | Tragic 3.5% |
Demographics Similar to Immigrants from Northern Europe by Professional Degree
In terms of professional degree, the demographic groups most similar to Immigrants from Northern Europe are Turkish (6.2%, a difference of 0.11%), Latvian (6.2%, a difference of 0.50%), Immigrants from Sri Lanka (6.2%, a difference of 0.75%), Immigrants from Turkey (6.2%, a difference of 0.75%), and Immigrants from India (6.2%, a difference of 0.87%).
| Demographics | Rating | Rank | Professional Degree |
| Immigrants | Denmark | 100.0 /100 | #20 | Exceptional 6.4% |
| Immigrants | Hong Kong | 100.0 /100 | #21 | Exceptional 6.4% |
| Immigrants | Japan | 100.0 /100 | #22 | Exceptional 6.4% |
| Russians | 100.0 /100 | #23 | Exceptional 6.3% |
| Immigrants | Spain | 100.0 /100 | #24 | Exceptional 6.3% |
| Immigrants | Ireland | 100.0 /100 | #25 | Exceptional 6.3% |
| Latvians | 100.0 /100 | #26 | Exceptional 6.2% |
| Immigrants | Northern Europe | 100.0 /100 | #27 | Exceptional 6.2% |
| Turks | 100.0 /100 | #28 | Exceptional 6.2% |
| Immigrants | Sri Lanka | 100.0 /100 | #29 | Exceptional 6.2% |
| Immigrants | Turkey | 100.0 /100 | #30 | Exceptional 6.2% |
| Immigrants | India | 100.0 /100 | #31 | Exceptional 6.2% |
| Thais | 100.0 /100 | #32 | Exceptional 6.1% |
| Burmese | 100.0 /100 | #33 | Exceptional 6.1% |
| Mongolians | 100.0 /100 | #34 | Exceptional 6.1% |