Colville vs Immigrants from Northern Europe Professional Degree
COMPARE
Colville
Immigrants from Northern Europe
Professional Degree
Professional Degree Comparison
Colville
Immigrants from Northern Europe
3.8%
PROFESSIONAL DEGREE
2.6/ 100
METRIC RATING
238th/ 347
METRIC RANK
6.2%
PROFESSIONAL DEGREE
100.0/ 100
METRIC RATING
27th/ 347
METRIC RANK
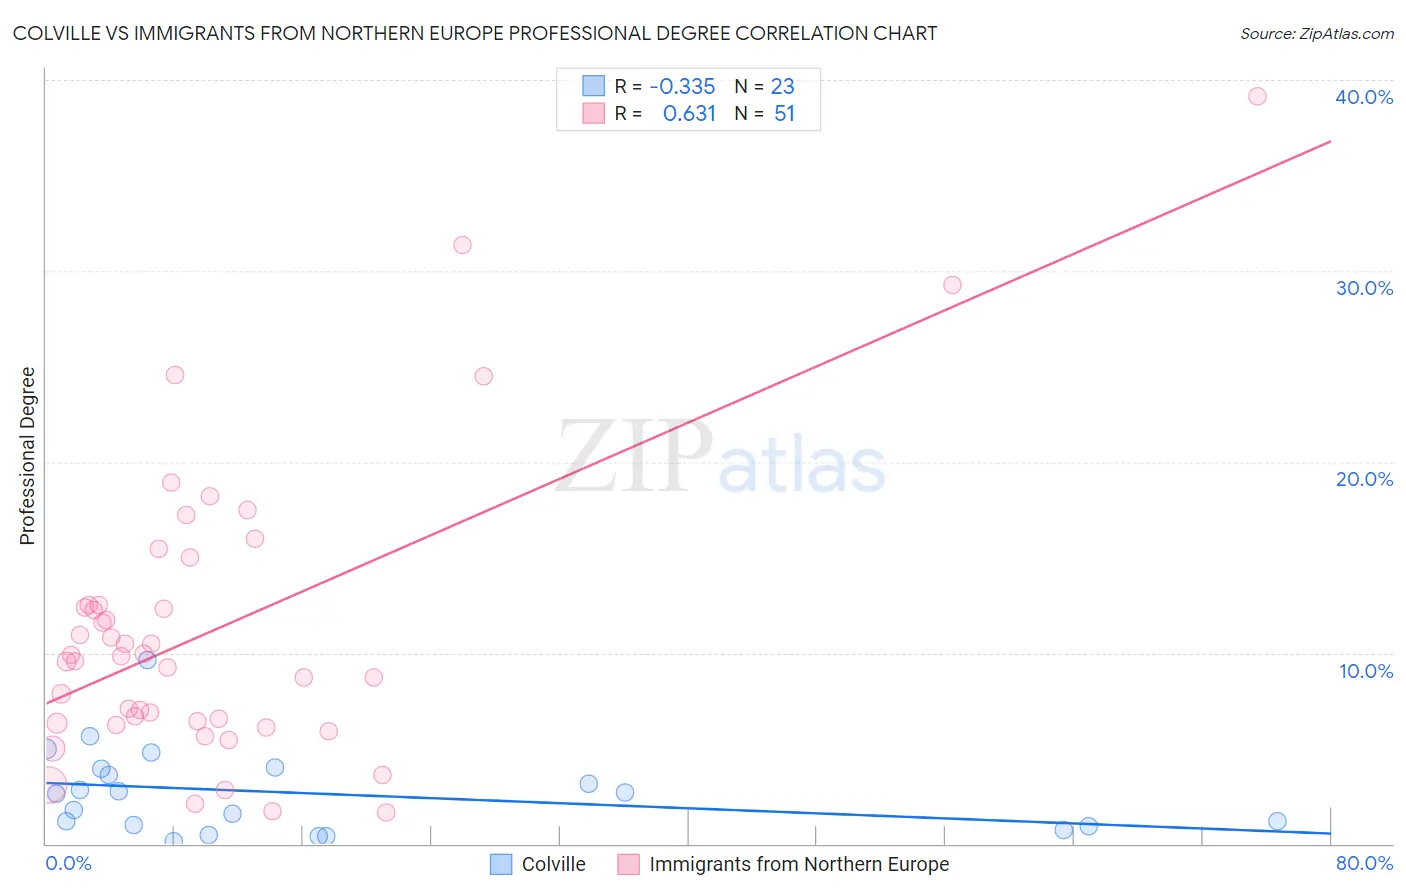
Colville vs Immigrants from Northern Europe Professional Degree Correlation Chart
The statistical analysis conducted on geographies consisting of 34,643,390 people shows a mild negative correlation between the proportion of Colville and percentage of population with at least professional degree education in the United States with a correlation coefficient (R) of -0.335 and weighted average of 3.8%. Similarly, the statistical analysis conducted on geographies consisting of 475,703,825 people shows a significant positive correlation between the proportion of Immigrants from Northern Europe and percentage of population with at least professional degree education in the United States with a correlation coefficient (R) of 0.631 and weighted average of 6.2%, a difference of 62.3%.
Professional Degree Correlation Summary
| Measurement | Colville | Immigrants from Northern Europe |
| Minimum | 0.12% | 1.7% |
| Maximum | 9.6% | 39.2% |
| Range | 9.5% | 37.5% |
| Mean | 2.6% | 11.3% |
| Median | 2.6% | 9.8% |
| Interquartile 25% (IQ1) | 0.93% | 6.3% |
| Interquartile 75% (IQ3) | 4.0% | 12.5% |
| Interquartile Range (IQR) | 3.0% | 6.2% |
| Standard Deviation (Sample) | 2.2% | 7.7% |
| Standard Deviation (Population) | 2.2% | 7.6% |
Similar Demographics by Professional Degree
Demographics Similar to Colville by Professional Degree
In terms of professional degree, the demographic groups most similar to Colville are British West Indian (3.8%, a difference of 0.39%), Immigrants from Ecuador (3.8%, a difference of 0.62%), Alaskan Athabascan (3.8%, a difference of 0.64%), Native Hawaiian (3.8%, a difference of 0.64%), and Guamanian/Chamorro (3.8%, a difference of 0.72%).
| Demographics | Rating | Rank | Professional Degree |
| Ecuadorians | 4.6 /100 | #231 | Tragic 3.9% |
| Cree | 4.3 /100 | #232 | Tragic 3.9% |
| Immigrants | Philippines | 4.1 /100 | #233 | Tragic 3.9% |
| Immigrants | Nonimmigrants | 4.0 /100 | #234 | Tragic 3.9% |
| Immigrants | Barbados | 4.0 /100 | #235 | Tragic 3.9% |
| Spanish Americans | 3.8 /100 | #236 | Tragic 3.9% |
| Immigrants | Trinidad and Tobago | 3.8 /100 | #237 | Tragic 3.9% |
| Colville | 2.6 /100 | #238 | Tragic 3.8% |
| British West Indians | 2.4 /100 | #239 | Tragic 3.8% |
| Immigrants | Ecuador | 2.3 /100 | #240 | Tragic 3.8% |
| Alaskan Athabascans | 2.3 /100 | #241 | Tragic 3.8% |
| Native Hawaiians | 2.3 /100 | #242 | Tragic 3.8% |
| Guamanians/Chamorros | 2.2 /100 | #243 | Tragic 3.8% |
| Immigrants | Bahamas | 2.0 /100 | #244 | Tragic 3.8% |
| French American Indians | 1.7 /100 | #245 | Tragic 3.8% |
Demographics Similar to Immigrants from Northern Europe by Professional Degree
In terms of professional degree, the demographic groups most similar to Immigrants from Northern Europe are Turkish (6.2%, a difference of 0.11%), Latvian (6.2%, a difference of 0.50%), Immigrants from Sri Lanka (6.2%, a difference of 0.75%), Immigrants from Turkey (6.2%, a difference of 0.75%), and Immigrants from India (6.2%, a difference of 0.87%).
| Demographics | Rating | Rank | Professional Degree |
| Immigrants | Denmark | 100.0 /100 | #20 | Exceptional 6.4% |
| Immigrants | Hong Kong | 100.0 /100 | #21 | Exceptional 6.4% |
| Immigrants | Japan | 100.0 /100 | #22 | Exceptional 6.4% |
| Russians | 100.0 /100 | #23 | Exceptional 6.3% |
| Immigrants | Spain | 100.0 /100 | #24 | Exceptional 6.3% |
| Immigrants | Ireland | 100.0 /100 | #25 | Exceptional 6.3% |
| Latvians | 100.0 /100 | #26 | Exceptional 6.2% |
| Immigrants | Northern Europe | 100.0 /100 | #27 | Exceptional 6.2% |
| Turks | 100.0 /100 | #28 | Exceptional 6.2% |
| Immigrants | Sri Lanka | 100.0 /100 | #29 | Exceptional 6.2% |
| Immigrants | Turkey | 100.0 /100 | #30 | Exceptional 6.2% |
| Immigrants | India | 100.0 /100 | #31 | Exceptional 6.2% |
| Thais | 100.0 /100 | #32 | Exceptional 6.1% |
| Burmese | 100.0 /100 | #33 | Exceptional 6.1% |
| Mongolians | 100.0 /100 | #34 | Exceptional 6.1% |