Chinese vs Immigrants from Bolivia Professional Degree
COMPARE
Chinese
Immigrants from Bolivia
Professional Degree
Professional Degree Comparison
Chinese
Immigrants from Bolivia
4.5%
PROFESSIONAL DEGREE
58.6/ 100
METRIC RATING
169th/ 347
METRIC RANK
5.5%
PROFESSIONAL DEGREE
99.9/ 100
METRIC RATING
65th/ 347
METRIC RANK
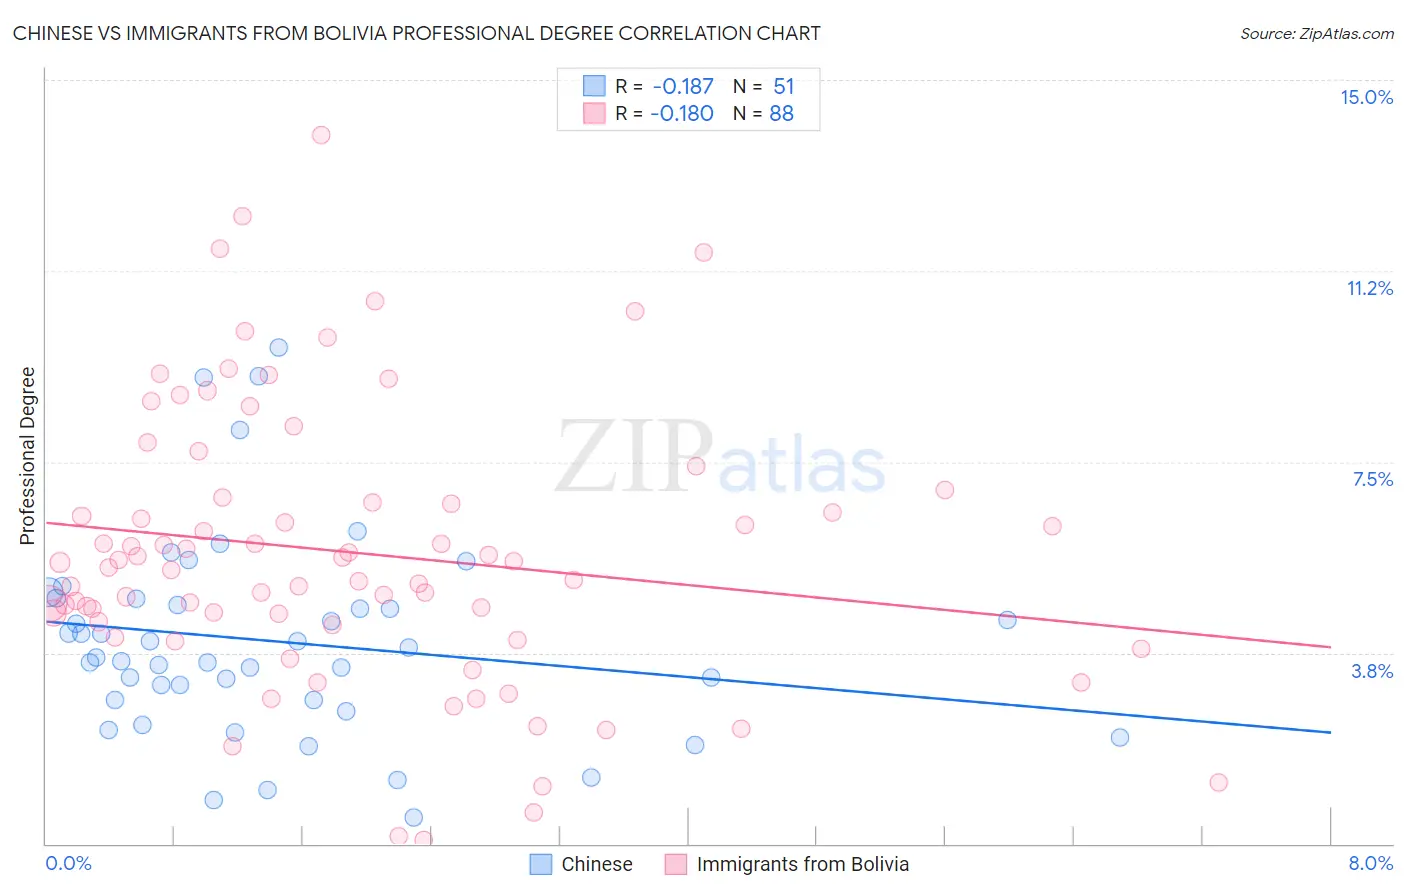
Chinese vs Immigrants from Bolivia Professional Degree Correlation Chart
The statistical analysis conducted on geographies consisting of 64,749,783 people shows a poor negative correlation between the proportion of Chinese and percentage of population with at least professional degree education in the United States with a correlation coefficient (R) of -0.187 and weighted average of 4.5%. Similarly, the statistical analysis conducted on geographies consisting of 158,681,411 people shows a poor negative correlation between the proportion of Immigrants from Bolivia and percentage of population with at least professional degree education in the United States with a correlation coefficient (R) of -0.180 and weighted average of 5.5%, a difference of 23.3%.
Professional Degree Correlation Summary
| Measurement | Chinese | Immigrants from Bolivia |
| Minimum | 0.52% | 0.081% |
| Maximum | 9.7% | 13.9% |
| Range | 9.2% | 13.8% |
| Mean | 4.0% | 5.7% |
| Median | 3.7% | 5.5% |
| Interquartile 25% (IQ1) | 2.8% | 4.3% |
| Interquartile 75% (IQ3) | 4.8% | 6.7% |
| Interquartile Range (IQR) | 2.0% | 2.4% |
| Standard Deviation (Sample) | 2.0% | 2.7% |
| Standard Deviation (Population) | 2.0% | 2.7% |
Similar Demographics by Professional Degree
Demographics Similar to Chinese by Professional Degree
In terms of professional degree, the demographic groups most similar to Chinese are Immigrants from Sierra Leone (4.5%, a difference of 0.020%), Immigrants from Afghanistan (4.5%, a difference of 0.080%), Immigrants from Colombia (4.5%, a difference of 0.11%), Immigrants from Zaire (4.5%, a difference of 0.18%), and Costa Rican (4.5%, a difference of 0.19%).
| Demographics | Rating | Rank | Professional Degree |
| Peruvians | 65.2 /100 | #162 | Good 4.5% |
| Sierra Leoneans | 64.3 /100 | #163 | Good 4.5% |
| Swiss | 61.0 /100 | #164 | Good 4.5% |
| Costa Ricans | 59.9 /100 | #165 | Average 4.5% |
| Immigrants | Colombia | 59.4 /100 | #166 | Average 4.5% |
| Immigrants | Afghanistan | 59.2 /100 | #167 | Average 4.5% |
| Immigrants | Sierra Leone | 58.7 /100 | #168 | Average 4.5% |
| Chinese | 58.6 /100 | #169 | Average 4.5% |
| Immigrants | Zaire | 57.4 /100 | #170 | Average 4.5% |
| Immigrants | Bangladesh | 56.0 /100 | #171 | Average 4.4% |
| Spaniards | 52.0 /100 | #172 | Average 4.4% |
| English | 50.1 /100 | #173 | Average 4.4% |
| Kenyans | 50.0 /100 | #174 | Average 4.4% |
| Irish | 50.0 /100 | #175 | Average 4.4% |
| Immigrants | Peru | 49.3 /100 | #176 | Average 4.4% |
Demographics Similar to Immigrants from Bolivia by Professional Degree
In terms of professional degree, the demographic groups most similar to Immigrants from Bolivia are Immigrants from Asia (5.5%, a difference of 0.060%), Asian (5.5%, a difference of 0.13%), Immigrants from Kazakhstan (5.5%, a difference of 0.24%), Immigrants from Belarus (5.5%, a difference of 0.56%), and Immigrants from Bulgaria (5.5%, a difference of 0.56%).
| Demographics | Rating | Rank | Professional Degree |
| Bulgarians | 100.0 /100 | #58 | Exceptional 5.7% |
| Immigrants | Europe | 100.0 /100 | #59 | Exceptional 5.6% |
| Bolivians | 99.9 /100 | #60 | Exceptional 5.6% |
| Immigrants | Lithuania | 99.9 /100 | #61 | Exceptional 5.6% |
| Immigrants | Belarus | 99.9 /100 | #62 | Exceptional 5.5% |
| Asians | 99.9 /100 | #63 | Exceptional 5.5% |
| Immigrants | Asia | 99.9 /100 | #64 | Exceptional 5.5% |
| Immigrants | Bolivia | 99.9 /100 | #65 | Exceptional 5.5% |
| Immigrants | Kazakhstan | 99.9 /100 | #66 | Exceptional 5.5% |
| Immigrants | Bulgaria | 99.9 /100 | #67 | Exceptional 5.5% |
| Immigrants | Lebanon | 99.9 /100 | #68 | Exceptional 5.5% |
| Immigrants | Hungary | 99.9 /100 | #69 | Exceptional 5.5% |
| Bhutanese | 99.8 /100 | #70 | Exceptional 5.4% |
| Immigrants | Western Asia | 99.8 /100 | #71 | Exceptional 5.4% |
| Lithuanians | 99.8 /100 | #72 | Exceptional 5.4% |