Nonimmigrants vs Immigrants from Bolivia Professional Degree
COMPARE
Nonimmigrants
Immigrants from Bolivia
Professional Degree
Professional Degree Comparison
Nonimmigrants
Immigrants from Bolivia
3.9%
PROFESSIONAL DEGREE
4.0/ 100
METRIC RATING
234th/ 347
METRIC RANK
5.5%
PROFESSIONAL DEGREE
99.9/ 100
METRIC RATING
65th/ 347
METRIC RANK
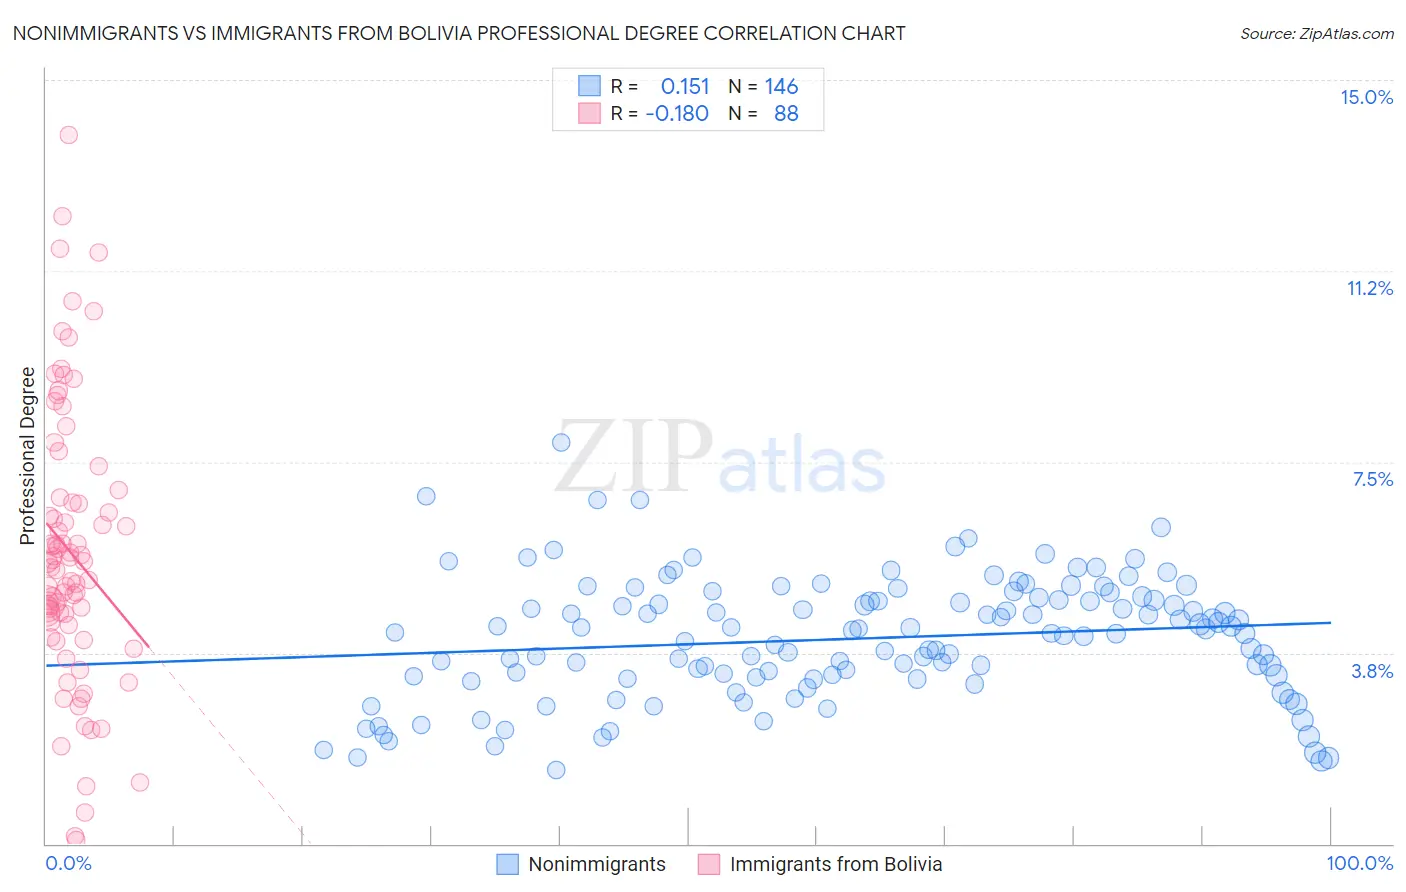
Nonimmigrants vs Immigrants from Bolivia Professional Degree Correlation Chart
The statistical analysis conducted on geographies consisting of 572,440,292 people shows a poor positive correlation between the proportion of Nonimmigrants and percentage of population with at least professional degree education in the United States with a correlation coefficient (R) of 0.151 and weighted average of 3.9%. Similarly, the statistical analysis conducted on geographies consisting of 158,681,411 people shows a poor negative correlation between the proportion of Immigrants from Bolivia and percentage of population with at least professional degree education in the United States with a correlation coefficient (R) of -0.180 and weighted average of 5.5%, a difference of 41.1%.
Professional Degree Correlation Summary
| Measurement | Nonimmigrants | Immigrants from Bolivia |
| Minimum | 1.4% | 0.081% |
| Maximum | 7.9% | 13.9% |
| Range | 6.4% | 13.8% |
| Mean | 4.0% | 5.7% |
| Median | 4.1% | 5.5% |
| Interquartile 25% (IQ1) | 3.3% | 4.3% |
| Interquartile 75% (IQ3) | 4.8% | 6.7% |
| Interquartile Range (IQR) | 1.5% | 2.4% |
| Standard Deviation (Sample) | 1.2% | 2.7% |
| Standard Deviation (Population) | 1.2% | 2.7% |
Similar Demographics by Professional Degree
Demographics Similar to Nonimmigrants by Professional Degree
In terms of professional degree, the demographic groups most similar to Nonimmigrants are Immigrants from Barbados (3.9%, a difference of 0.010%), Immigrants from Philippines (3.9%, a difference of 0.050%), Spanish American (3.9%, a difference of 0.23%), Cree (3.9%, a difference of 0.30%), and Immigrants from Trinidad and Tobago (3.9%, a difference of 0.30%).
| Demographics | Rating | Rank | Professional Degree |
| Cubans | 5.9 /100 | #227 | Tragic 4.0% |
| Immigrants | West Indies | 5.6 /100 | #228 | Tragic 4.0% |
| Immigrants | Burma/Myanmar | 5.4 /100 | #229 | Tragic 3.9% |
| Nicaraguans | 5.1 /100 | #230 | Tragic 3.9% |
| Ecuadorians | 4.6 /100 | #231 | Tragic 3.9% |
| Cree | 4.3 /100 | #232 | Tragic 3.9% |
| Immigrants | Philippines | 4.1 /100 | #233 | Tragic 3.9% |
| Immigrants | Nonimmigrants | 4.0 /100 | #234 | Tragic 3.9% |
| Immigrants | Barbados | 4.0 /100 | #235 | Tragic 3.9% |
| Spanish Americans | 3.8 /100 | #236 | Tragic 3.9% |
| Immigrants | Trinidad and Tobago | 3.8 /100 | #237 | Tragic 3.9% |
| Colville | 2.6 /100 | #238 | Tragic 3.8% |
| British West Indians | 2.4 /100 | #239 | Tragic 3.8% |
| Immigrants | Ecuador | 2.3 /100 | #240 | Tragic 3.8% |
| Alaskan Athabascans | 2.3 /100 | #241 | Tragic 3.8% |
Demographics Similar to Immigrants from Bolivia by Professional Degree
In terms of professional degree, the demographic groups most similar to Immigrants from Bolivia are Immigrants from Asia (5.5%, a difference of 0.060%), Asian (5.5%, a difference of 0.13%), Immigrants from Kazakhstan (5.5%, a difference of 0.24%), Immigrants from Belarus (5.5%, a difference of 0.56%), and Immigrants from Bulgaria (5.5%, a difference of 0.56%).
| Demographics | Rating | Rank | Professional Degree |
| Bulgarians | 100.0 /100 | #58 | Exceptional 5.7% |
| Immigrants | Europe | 100.0 /100 | #59 | Exceptional 5.6% |
| Bolivians | 99.9 /100 | #60 | Exceptional 5.6% |
| Immigrants | Lithuania | 99.9 /100 | #61 | Exceptional 5.6% |
| Immigrants | Belarus | 99.9 /100 | #62 | Exceptional 5.5% |
| Asians | 99.9 /100 | #63 | Exceptional 5.5% |
| Immigrants | Asia | 99.9 /100 | #64 | Exceptional 5.5% |
| Immigrants | Bolivia | 99.9 /100 | #65 | Exceptional 5.5% |
| Immigrants | Kazakhstan | 99.9 /100 | #66 | Exceptional 5.5% |
| Immigrants | Bulgaria | 99.9 /100 | #67 | Exceptional 5.5% |
| Immigrants | Lebanon | 99.9 /100 | #68 | Exceptional 5.5% |
| Immigrants | Hungary | 99.9 /100 | #69 | Exceptional 5.5% |
| Bhutanese | 99.8 /100 | #70 | Exceptional 5.4% |
| Immigrants | Western Asia | 99.8 /100 | #71 | Exceptional 5.4% |
| Lithuanians | 99.8 /100 | #72 | Exceptional 5.4% |