Immigrants from Uganda vs Hawaiian Associate's Degree
COMPARE
Immigrants from Uganda
Hawaiian
Associate's Degree
Associate's Degree Comparison
Immigrants from Uganda
Hawaiians
48.5%
ASSOCIATE'S DEGREE
92.1/ 100
METRIC RATING
127th/ 347
METRIC RANK
40.9%
ASSOCIATE'S DEGREE
0.2/ 100
METRIC RATING
267th/ 347
METRIC RANK
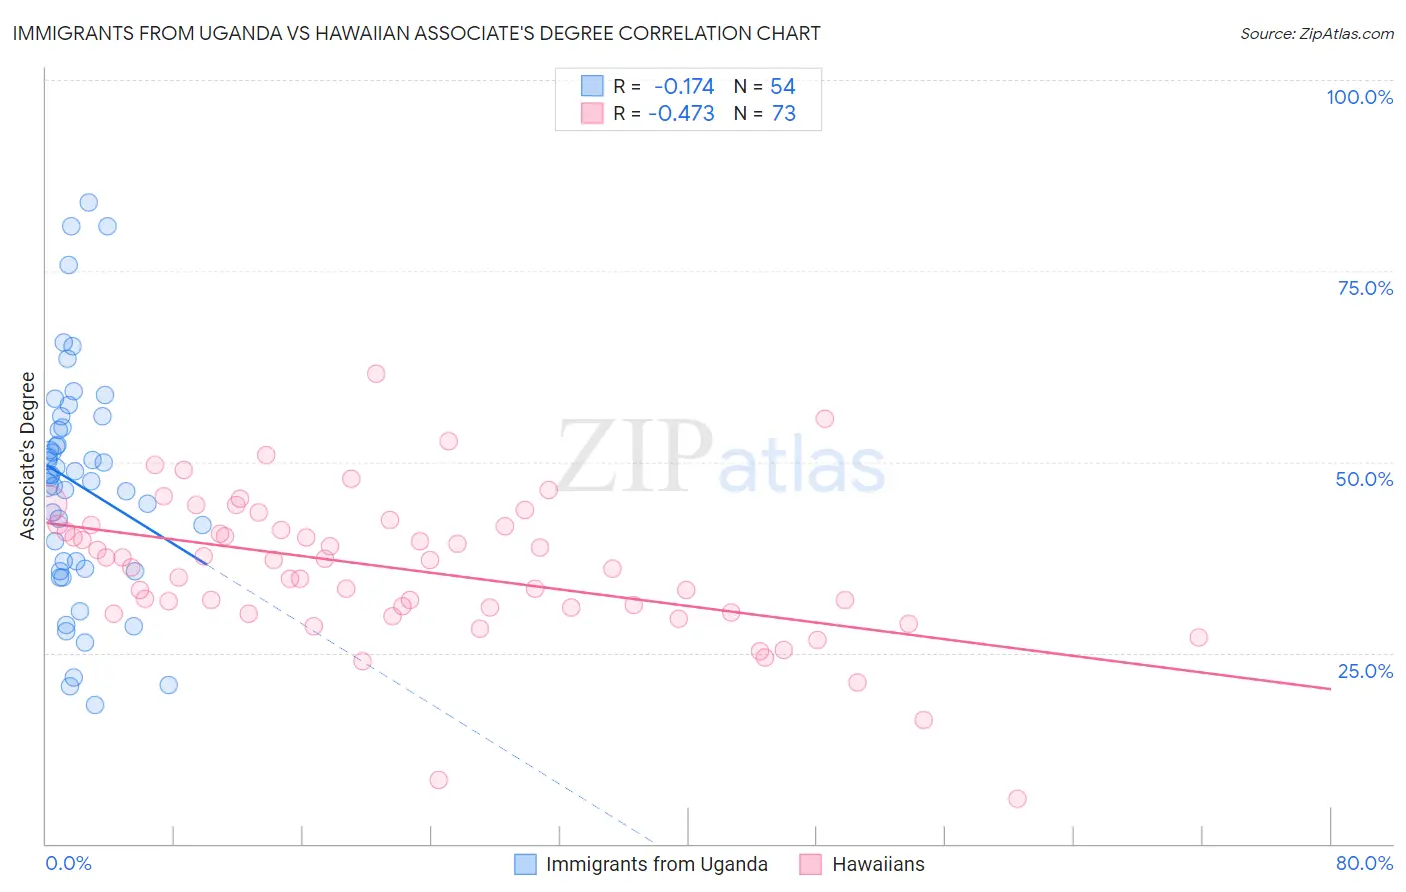
Immigrants from Uganda vs Hawaiian Associate's Degree Correlation Chart
The statistical analysis conducted on geographies consisting of 125,982,535 people shows a poor negative correlation between the proportion of Immigrants from Uganda and percentage of population with at least associate's degree education in the United States with a correlation coefficient (R) of -0.174 and weighted average of 48.5%. Similarly, the statistical analysis conducted on geographies consisting of 327,594,754 people shows a moderate negative correlation between the proportion of Hawaiians and percentage of population with at least associate's degree education in the United States with a correlation coefficient (R) of -0.473 and weighted average of 40.9%, a difference of 18.5%.
Associate's Degree Correlation Summary
| Measurement | Immigrants from Uganda | Hawaiian |
| Minimum | 18.1% | 5.9% |
| Maximum | 84.0% | 61.5% |
| Range | 65.9% | 55.7% |
| Mean | 47.0% | 36.0% |
| Median | 48.2% | 37.2% |
| Interquartile 25% (IQ1) | 36.0% | 30.6% |
| Interquartile 75% (IQ3) | 54.5% | 41.7% |
| Interquartile Range (IQR) | 18.5% | 11.0% |
| Standard Deviation (Sample) | 15.0% | 9.5% |
| Standard Deviation (Population) | 14.9% | 9.4% |
Similar Demographics by Associate's Degree
Demographics Similar to Immigrants from Uganda by Associate's Degree
In terms of associate's degree, the demographic groups most similar to Immigrants from Uganda are Immigrants from Syria (48.5%, a difference of 0.010%), Chinese (48.5%, a difference of 0.10%), Serbian (48.5%, a difference of 0.12%), Immigrants from Eastern Africa (48.4%, a difference of 0.12%), and Swedish (48.4%, a difference of 0.15%).
| Demographics | Rating | Rank | Associate's Degree |
| Alsatians | 94.6 /100 | #120 | Exceptional 48.8% |
| Ugandans | 93.9 /100 | #121 | Exceptional 48.7% |
| Italians | 93.9 /100 | #122 | Exceptional 48.7% |
| Brazilians | 93.7 /100 | #123 | Exceptional 48.7% |
| Serbians | 92.6 /100 | #124 | Exceptional 48.5% |
| Chinese | 92.5 /100 | #125 | Exceptional 48.5% |
| Immigrants | Syria | 92.2 /100 | #126 | Exceptional 48.5% |
| Immigrants | Uganda | 92.1 /100 | #127 | Exceptional 48.5% |
| Immigrants | Eastern Africa | 91.6 /100 | #128 | Exceptional 48.4% |
| Swedes | 91.5 /100 | #129 | Exceptional 48.4% |
| Immigrants | Jordan | 91.2 /100 | #130 | Exceptional 48.4% |
| Icelanders | 90.8 /100 | #131 | Exceptional 48.3% |
| Immigrants | Albania | 89.9 /100 | #132 | Excellent 48.2% |
| Assyrians/Chaldeans/Syriacs | 89.4 /100 | #133 | Excellent 48.2% |
| Moroccans | 89.3 /100 | #134 | Excellent 48.2% |
Demographics Similar to Hawaiians by Associate's Degree
In terms of associate's degree, the demographic groups most similar to Hawaiians are Central American Indian (40.8%, a difference of 0.20%), American (40.8%, a difference of 0.38%), Chippewa (40.7%, a difference of 0.42%), African (41.1%, a difference of 0.56%), and Samoan (41.1%, a difference of 0.56%).
| Demographics | Rating | Rank | Associate's Degree |
| Marshallese | 0.4 /100 | #260 | Tragic 41.6% |
| Nicaraguans | 0.4 /100 | #261 | Tragic 41.5% |
| Bahamians | 0.4 /100 | #262 | Tragic 41.5% |
| Immigrants | Jamaica | 0.3 /100 | #263 | Tragic 41.5% |
| Osage | 0.3 /100 | #264 | Tragic 41.5% |
| Africans | 0.2 /100 | #265 | Tragic 41.1% |
| Samoans | 0.2 /100 | #266 | Tragic 41.1% |
| Hawaiians | 0.2 /100 | #267 | Tragic 40.9% |
| Central American Indians | 0.2 /100 | #268 | Tragic 40.8% |
| Americans | 0.2 /100 | #269 | Tragic 40.8% |
| Chippewa | 0.2 /100 | #270 | Tragic 40.7% |
| Immigrants | Laos | 0.1 /100 | #271 | Tragic 40.7% |
| Belizeans | 0.1 /100 | #272 | Tragic 40.6% |
| Puget Sound Salish | 0.1 /100 | #273 | Tragic 40.5% |
| Immigrants | Dominica | 0.1 /100 | #274 | Tragic 40.5% |