Ottawa vs Bermudan 6th Grade
COMPARE
Ottawa
Bermudan
6th Grade
6th Grade Comparison
Ottawa
Bermudans
98.5%
6TH GRADE
100.0/ 100
METRIC RATING
2nd/ 347
METRIC RANK
97.1%
6TH GRADE
52.6/ 100
METRIC RATING
169th/ 347
METRIC RANK
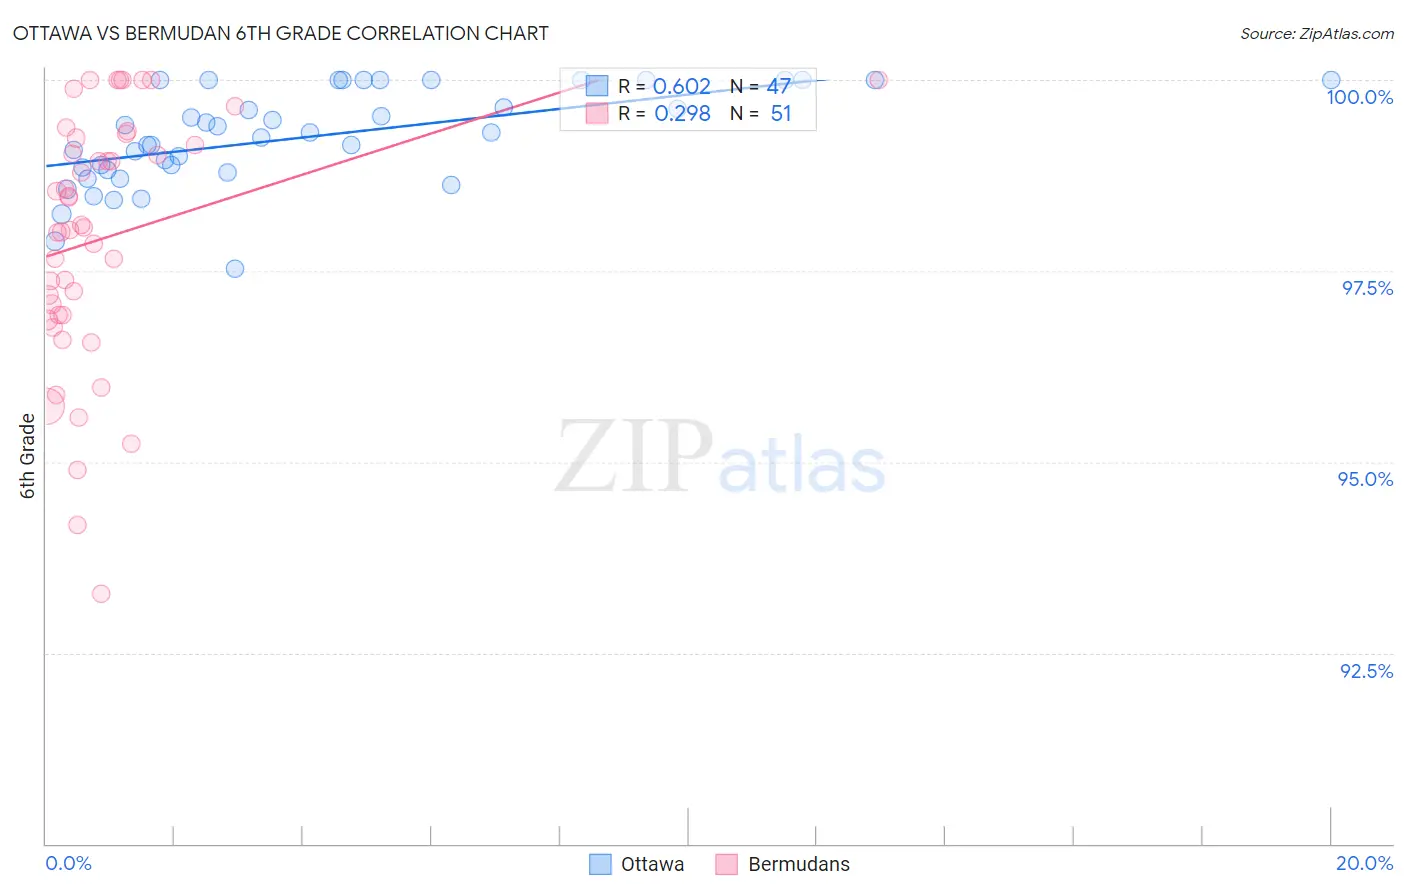
Ottawa vs Bermudan 6th Grade Correlation Chart
The statistical analysis conducted on geographies consisting of 4,824,405 people shows a significant positive correlation between the proportion of Ottawa and percentage of population with at least 6th grade education in the United States with a correlation coefficient (R) of 0.602 and weighted average of 98.5%. Similarly, the statistical analysis conducted on geographies consisting of 55,721,975 people shows a weak positive correlation between the proportion of Bermudans and percentage of population with at least 6th grade education in the United States with a correlation coefficient (R) of 0.298 and weighted average of 97.1%, a difference of 1.5%.
6th Grade Correlation Summary
| Measurement | Ottawa | Bermudan |
| Minimum | 97.5% | 93.3% |
| Maximum | 100.0% | 100.0% |
| Range | 2.5% | 6.7% |
| Mean | 99.3% | 97.9% |
| Median | 99.3% | 98.1% |
| Interquartile 25% (IQ1) | 98.8% | 96.9% |
| Interquartile 75% (IQ3) | 100.0% | 99.2% |
| Interquartile Range (IQR) | 1.2% | 2.3% |
| Standard Deviation (Sample) | 0.63% | 1.6% |
| Standard Deviation (Population) | 0.62% | 1.6% |
Similar Demographics by 6th Grade
Demographics Similar to Ottawa by 6th Grade
In terms of 6th grade, the demographic groups most similar to Ottawa are Welsh (98.5%, a difference of 0.010%), Dutch (98.4%, a difference of 0.14%), Tsimshian (98.3%, a difference of 0.21%), Norwegian (98.3%, a difference of 0.21%), and German (98.2%, a difference of 0.25%).
| Demographics | Rating | Rank | 6th Grade |
| Crow | 100.0 /100 | #1 | Exceptional 99.4% |
| Ottawa | 100.0 /100 | #2 | Exceptional 98.5% |
| Welsh | 100.0 /100 | #3 | Exceptional 98.5% |
| Dutch | 100.0 /100 | #4 | Exceptional 98.4% |
| Tsimshian | 100.0 /100 | #5 | Exceptional 98.3% |
| Norwegians | 100.0 /100 | #6 | Exceptional 98.3% |
| Germans | 100.0 /100 | #7 | Exceptional 98.2% |
| Slovaks | 100.0 /100 | #8 | Exceptional 98.2% |
| Slovenes | 100.0 /100 | #9 | Exceptional 98.2% |
| Swedes | 100.0 /100 | #10 | Exceptional 98.2% |
| English | 100.0 /100 | #11 | Exceptional 98.1% |
| Alaskan Athabascans | 100.0 /100 | #12 | Exceptional 98.1% |
| Tlingit-Haida | 100.0 /100 | #13 | Exceptional 98.1% |
| Carpatho Rusyns | 100.0 /100 | #14 | Exceptional 98.1% |
| Inupiat | 100.0 /100 | #15 | Exceptional 98.1% |
Demographics Similar to Bermudans by 6th Grade
In terms of 6th grade, the demographic groups most similar to Bermudans are Apache (97.1%, a difference of 0.0%), Immigrants from Taiwan (97.1%, a difference of 0.0%), Chilean (97.1%, a difference of 0.0%), Immigrants from Sri Lanka (97.1%, a difference of 0.0%), and Immigrants from Italy (97.1%, a difference of 0.010%).
| Demographics | Rating | Rank | 6th Grade |
| Marshallese | 60.2 /100 | #162 | Good 97.1% |
| Albanians | 57.8 /100 | #163 | Average 97.1% |
| Immigrants | Korea | 57.7 /100 | #164 | Average 97.1% |
| Immigrants | Poland | 56.2 /100 | #165 | Average 97.1% |
| Immigrants | Italy | 53.8 /100 | #166 | Average 97.1% |
| Apache | 53.6 /100 | #167 | Average 97.1% |
| Immigrants | Taiwan | 53.5 /100 | #168 | Average 97.1% |
| Bermudans | 52.6 /100 | #169 | Average 97.1% |
| Chileans | 52.1 /100 | #170 | Average 97.1% |
| Immigrants | Sri Lanka | 51.7 /100 | #171 | Average 97.1% |
| Egyptians | 50.9 /100 | #172 | Average 97.1% |
| Arabs | 50.1 /100 | #173 | Average 97.0% |
| Venezuelans | 50.0 /100 | #174 | Average 97.0% |
| Immigrants | Kazakhstan | 47.3 /100 | #175 | Average 97.0% |
| Immigrants | Micronesia | 47.1 /100 | #176 | Average 97.0% |