Osage vs Peruvian 11th Grade
COMPARE
Osage
Peruvian
11th Grade
11th Grade Comparison
Osage
Peruvians
92.7%
11TH GRADE
73.4/ 100
METRIC RATING
154th/ 347
METRIC RANK
91.5%
11TH GRADE
1.0/ 100
METRIC RATING
249th/ 347
METRIC RANK
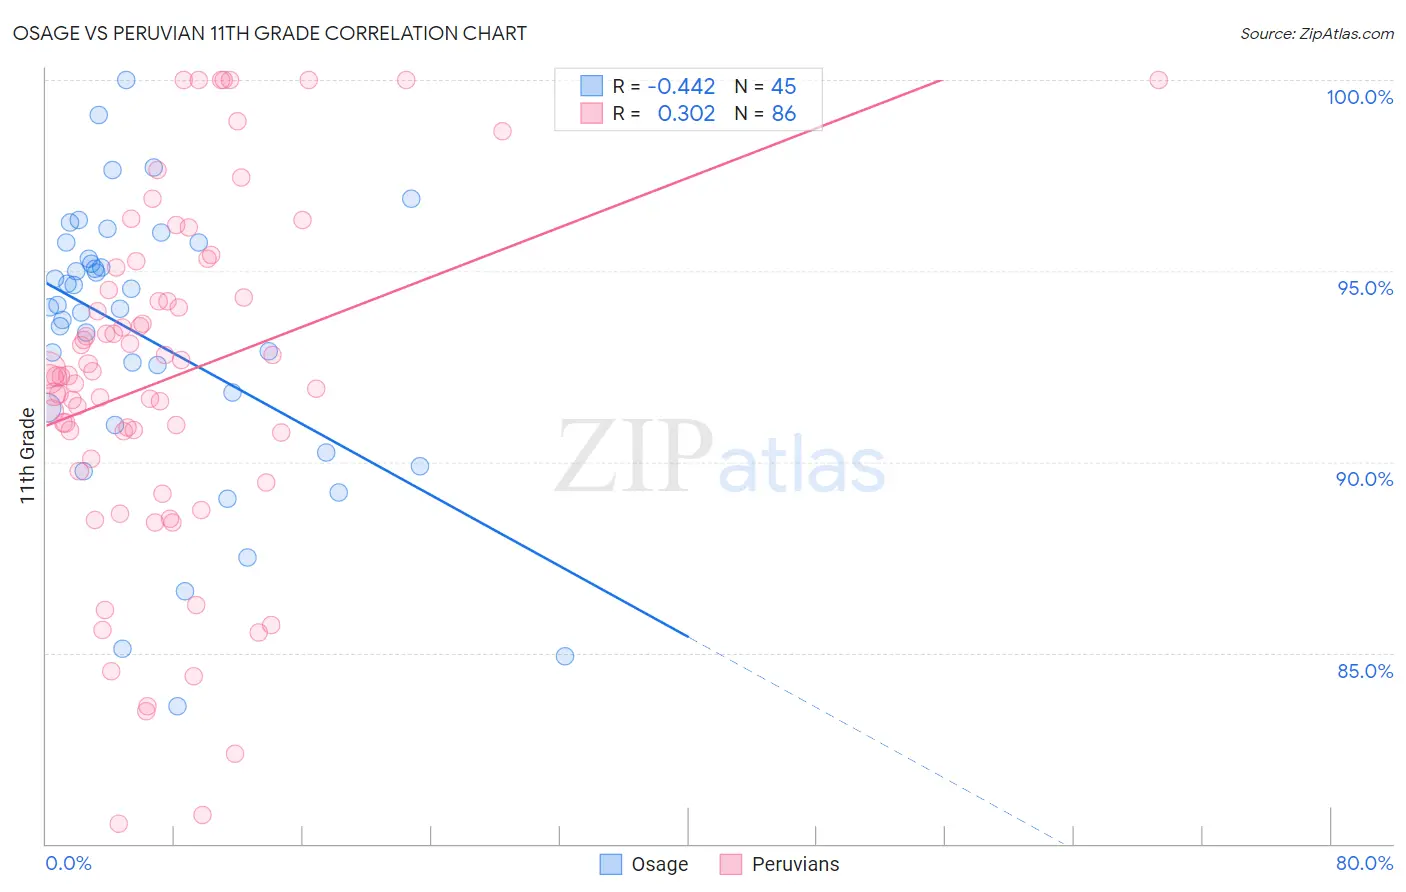
Osage vs Peruvian 11th Grade Correlation Chart
The statistical analysis conducted on geographies consisting of 91,808,929 people shows a moderate negative correlation between the proportion of Osage and percentage of population with at least 11th grade education in the United States with a correlation coefficient (R) of -0.442 and weighted average of 92.7%. Similarly, the statistical analysis conducted on geographies consisting of 363,251,075 people shows a mild positive correlation between the proportion of Peruvians and percentage of population with at least 11th grade education in the United States with a correlation coefficient (R) of 0.302 and weighted average of 91.5%, a difference of 1.4%.
11th Grade Correlation Summary
| Measurement | Osage | Peruvian |
| Minimum | 83.6% | 80.5% |
| Maximum | 100.0% | 100.0% |
| Range | 16.4% | 19.5% |
| Mean | 93.2% | 92.2% |
| Median | 94.1% | 92.2% |
| Interquartile 25% (IQ1) | 91.2% | 90.1% |
| Interquartile 75% (IQ3) | 95.5% | 94.5% |
| Interquartile Range (IQR) | 4.3% | 4.4% |
| Standard Deviation (Sample) | 3.7% | 4.5% |
| Standard Deviation (Population) | 3.6% | 4.5% |
Similar Demographics by 11th Grade
Demographics Similar to Osage by 11th Grade
In terms of 11th grade, the demographic groups most similar to Osage are Argentinean (92.7%, a difference of 0.0%), Immigrants from Spain (92.7%, a difference of 0.0%), Potawatomi (92.8%, a difference of 0.010%), Iraqi (92.8%, a difference of 0.010%), and Brazilian (92.8%, a difference of 0.010%).
| Demographics | Rating | Rank | 11th Grade |
| Immigrants | Kenya | 78.7 /100 | #147 | Good 92.8% |
| Hmong | 78.6 /100 | #148 | Good 92.8% |
| Immigrants | Poland | 78.5 /100 | #149 | Good 92.8% |
| Immigrants | Egypt | 77.5 /100 | #150 | Good 92.8% |
| Potawatomi | 74.3 /100 | #151 | Good 92.8% |
| Iraqis | 74.2 /100 | #152 | Good 92.8% |
| Brazilians | 73.9 /100 | #153 | Good 92.8% |
| Osage | 73.4 /100 | #154 | Good 92.7% |
| Argentineans | 73.4 /100 | #155 | Good 92.7% |
| Immigrants | Spain | 73.0 /100 | #156 | Good 92.7% |
| Immigrants | Eastern Asia | 72.6 /100 | #157 | Good 92.7% |
| Immigrants | Venezuela | 72.0 /100 | #158 | Good 92.7% |
| Americans | 71.7 /100 | #159 | Good 92.7% |
| Immigrants | Lebanon | 70.7 /100 | #160 | Good 92.7% |
| Immigrants | Argentina | 69.8 /100 | #161 | Good 92.7% |
Demographics Similar to Peruvians by 11th Grade
In terms of 11th grade, the demographic groups most similar to Peruvians are Immigrants from Uzbekistan (91.5%, a difference of 0.0%), Ghanaian (91.5%, a difference of 0.0%), Immigrants from Philippines (91.5%, a difference of 0.010%), Immigrants from Costa Rica (91.4%, a difference of 0.020%), and Immigrants from Nigeria (91.4%, a difference of 0.040%).
| Demographics | Rating | Rank | 11th Grade |
| Immigrants | Middle Africa | 1.6 /100 | #242 | Tragic 91.6% |
| Immigrants | Thailand | 1.4 /100 | #243 | Tragic 91.6% |
| Senegalese | 1.4 /100 | #244 | Tragic 91.6% |
| Africans | 1.3 /100 | #245 | Tragic 91.5% |
| Seminole | 1.2 /100 | #246 | Tragic 91.5% |
| Immigrants | Philippines | 1.0 /100 | #247 | Tragic 91.5% |
| Immigrants | Uzbekistan | 1.0 /100 | #248 | Tragic 91.5% |
| Peruvians | 1.0 /100 | #249 | Tragic 91.5% |
| Ghanaians | 0.9 /100 | #250 | Tragic 91.5% |
| Immigrants | Costa Rica | 0.9 /100 | #251 | Tragic 91.4% |
| Immigrants | Nigeria | 0.8 /100 | #252 | Tragic 91.4% |
| Immigrants | South America | 0.8 /100 | #253 | Tragic 91.4% |
| Immigrants | Eritrea | 0.7 /100 | #254 | Tragic 91.4% |
| Blacks/African Americans | 0.7 /100 | #255 | Tragic 91.4% |
| Immigrants | Senegal | 0.7 /100 | #256 | Tragic 91.4% |